Valuation Lines
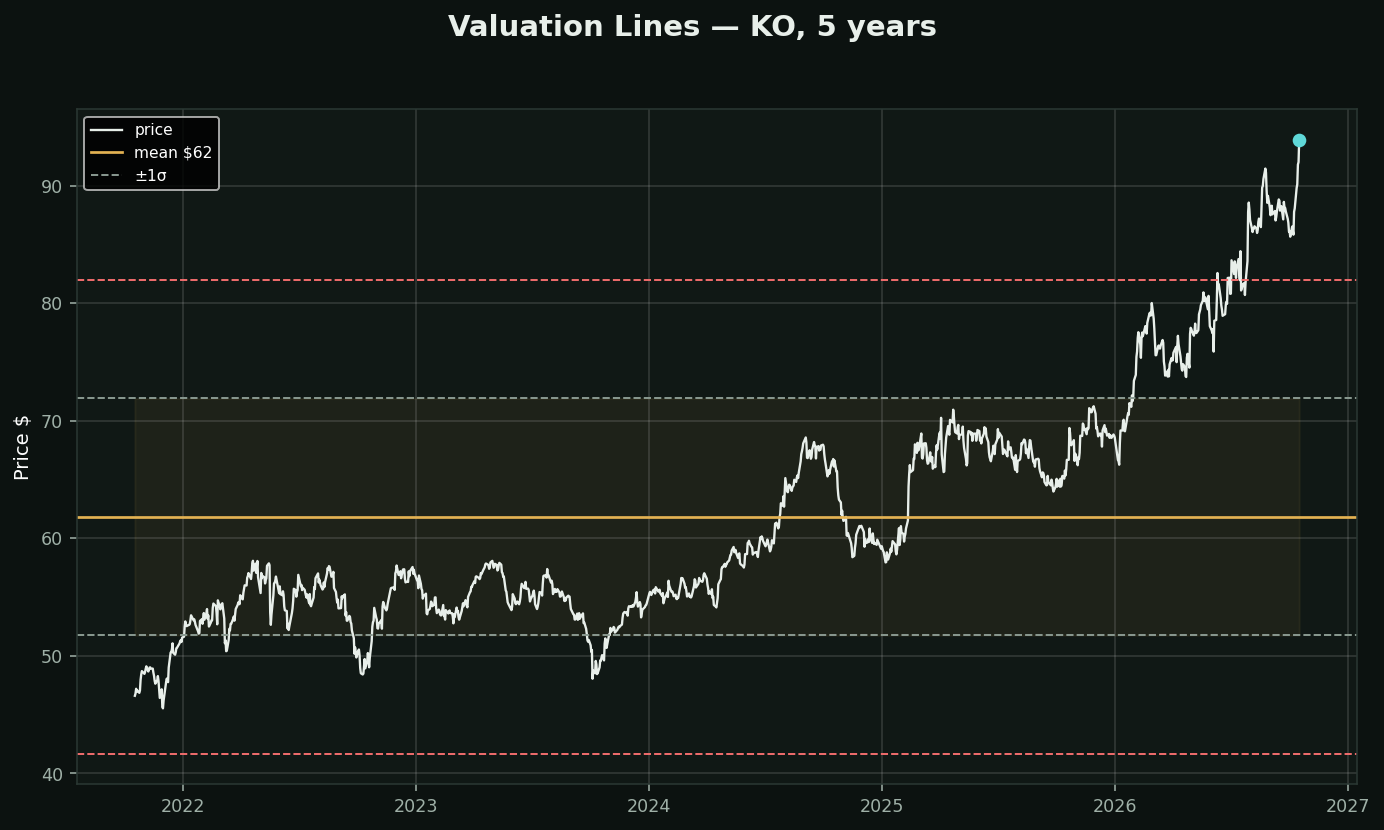
What it is: horizontal lines at the mean of price over the chosen window, with standard-deviation lines above and below. Static — they do not move as price does.
The word 'valuation' is doing a lot of work here, and it is worth challenging. This measures nothing about the business. It is the average of a price series. A stock that has doubled on genuinely doubled earnings sits at +2σ and is not expensive; a stock at -2σ because its main product was recalled is not cheap.
What it IS good for: a fast read on where you are in a range, on instruments that actually mean-revert. Currency pairs, spreads, commodities in a stable regime, and mature dividend names in a flat decade. Those genuinely oscillate around a level.
Chart: KO over five years — currently +3.2σ from its own mean.
The trap to name out loud: on anything with a real growth trend, this indicator will tell you to sell every year forever. Price spends the entire period above a mean that is dragged down by history. The real valuation tools are on the other track — `pe`, `ev-ebitda`, `roic`, `fcf` — and they ask about the business, which is the only thing that can make a price cheap.