The Moving Average Cross
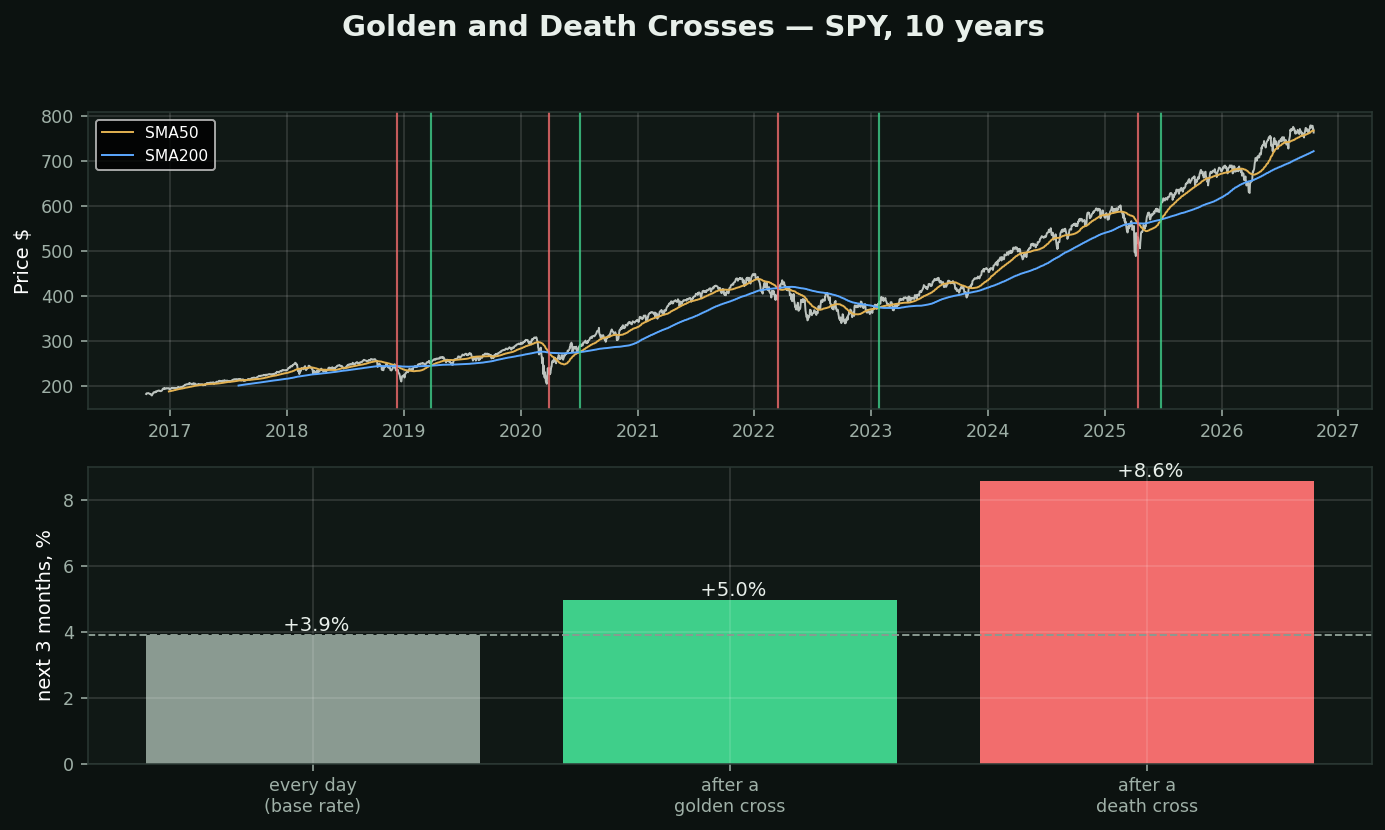
What it is: the 50-day average crossing the 200-day. Up through is the golden cross, down through is the death cross. The most widely reported signal in retail technical analysis — it gets television coverage.
What the bottom panel is: the average return over the NEXT three months, measured three ways on this chart — every day (the base rate), after each of the 4 golden crosses, and after each of the 4 death crosses.
Read the bars against the dashed line, not against zero. A signal that precedes a gain in a market that rises anyway has told you nothing. The base rate is the thing to beat, and almost nobody quotes it alongside the signal.
On this window the death cross wins. Golden +5.0%, death +8.6%, base rate +3.9%. The signal sold as bearish preceded the better three months.
And this is one chart, one ticker, 8 events. That is not a sample you can conclude anything from — it is an illustration of *how to ask*, not an answer.
What a real sample found here: across 413,946 stock-days, this exact condition — price above a rising 50 above a 200 — preceded -0.46% over 21 days (t=-4.40), while downtrend preceded +1.14% (t=+6.02). Both sample halves agreed. The toolkit's own engines had to invert this leg.
The cross is a description of the past. It is not a forecast, and the most famous signal in the field is the one the numbers contradict most directly.