How to test an indicator yourself
You have now seen about 60 technical studies. This is the lesson that tells you what to do with any of them.
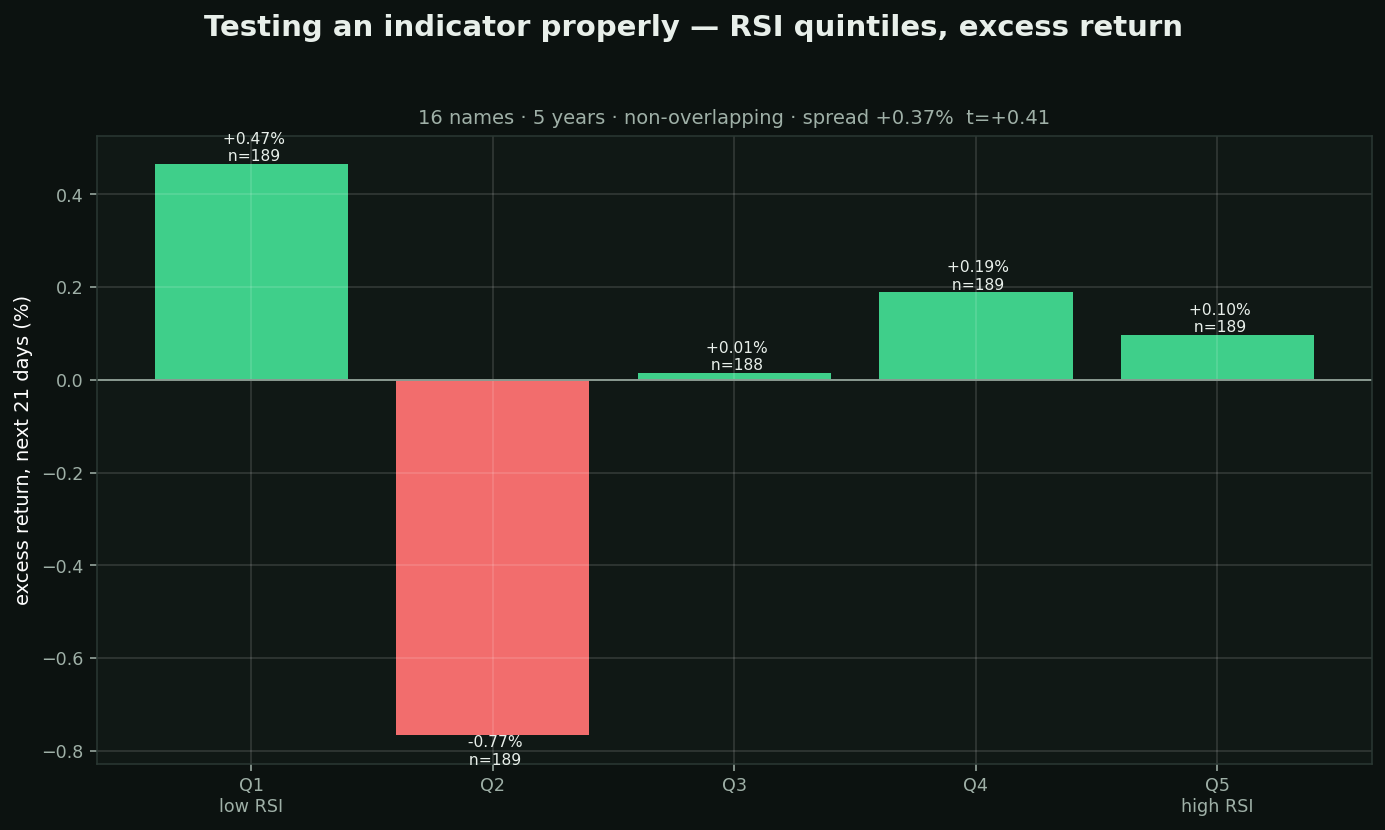
Four rules, and the chart above follows all four:
1. Compare to the base rate, not to zero. A signal that precedes +8% in a market that returned +8% found nothing. Here every return is excess — measured against what every other stock did that same month — so the market's own move is removed.
2. Use a cross-section, not one chart. One ticker gives you a handful of events and a story. This uses 16 names over 5 years.
3. Do not overlap your windows. Twenty-one-day forward returns taken daily share 20 of 21 days with each other. That is not 1,200 independent observations, it is about 57 — and overlapping samples inflate significance dramatically. Sampling every 21st day fixes it.
4. Raise the bar for the number of things you tried. One test needs t ≈ 2. Thirteen tests need t ≈ 3.0 before you should believe any of them. Try enough indicators and one always looks brilliant.
Result on this demo sample: low-RSI minus high-RSI = +0.37% at t=+0.41 — which does NOT clear the t=3.0 bar.
And here is rule five, which the chart just demonstrated on itself. The RSI lesson in this catalogue reports +0.82% at t=+4.09 — a clear result. This chart uses 16 names and 5 years because it has to build in seconds; that is roughly 57 independent dates. The real test used 177 names over 10 years and 413,946 stock-days.
Same signal, same method, opposite conclusion — because the sample is too small. A weak result on a small sample is not evidence against a signal, and a strong one is not evidence for it. Before you believe any number here, ask how many independent observations produced it.
Run this on your own favourite study before you trade it — and on a sample big enough to answer.