Median, Typical and Weighted Close
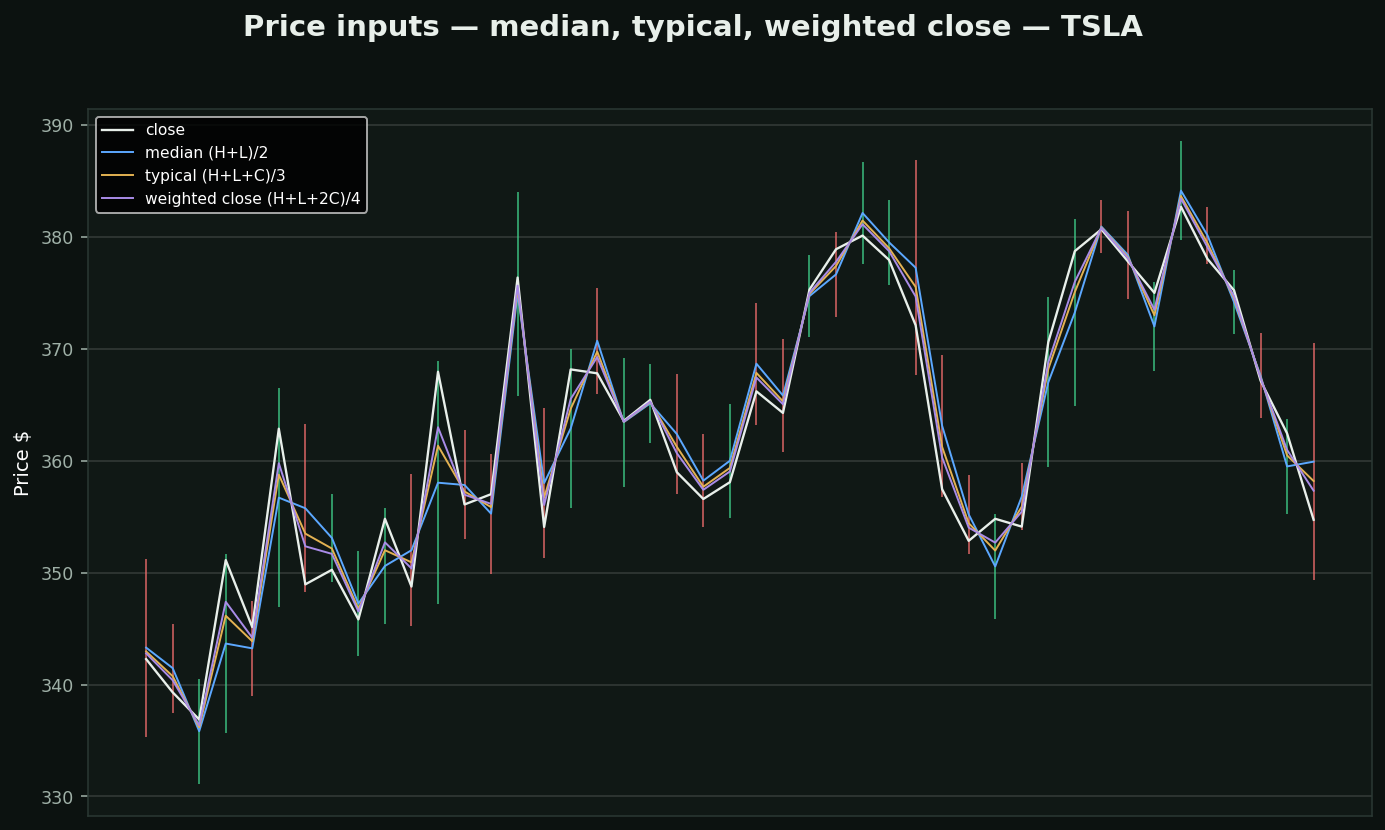
These are not indicators. They are the INPUT you feed an indicator, and your platform lists them beside real studies, which is why everyone is confused by them.
• Median Price = (H + L) / 2
• Typical Price = (H + L + C) / 3
• Weighted Close = (H + L + 2C) / 4
Why they exist: almost every indicator you know defaults to the close. The close is one instant — 4:00:00pm — and it is the most distorted price of the day: closing auctions, index rebalances, month-end marks and deliberate closing-price pressure all land there. These alternatives ask the whole bar instead of one second of it.
Where they are already in use without being announced: CCI, Money Flow Index and volume profile are built on typical price. The Awesome Oscillator and Ichimoku use the median. If you have run any of those, you have used these.
On this chart typical price differs from the close by $1.92 a day on average.
How to use them: swap the input on an indicator that is whipsawing you on closing prints. It is a smaller, cheaper fix than adding another study — and unlike adding a study, it does not add another correlated opinion to a chart that already has too many.