PEG ratio (P/E ÷ Growth)
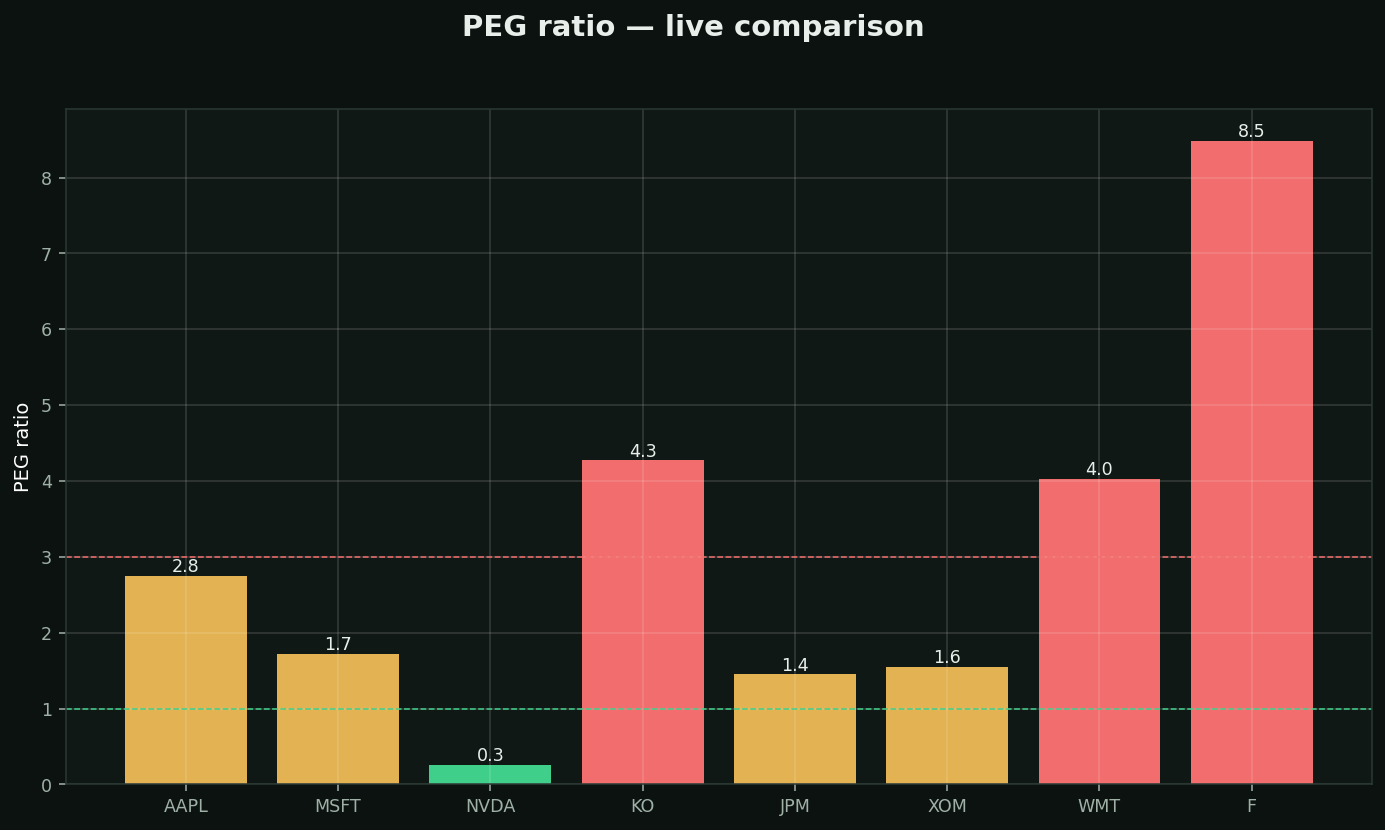
What it is: the P/E ratio adjusted for how fast earnings are growing — the fix for P/E's biggest blind spot.
Rules of thumb:
• Under 1.0 (green) = you're paying less than the growth justifies — the classic GARP buy
• 1-2 = fair · over 3 (red) = paying for growth that better actually show up
Why it beats raw P/E: a P/E of 40 with 50% growth (PEG 0.8) is CHEAPER in real terms than a P/E of 15 with 3% growth (PEG 5).
Watch out: PEG uses *forecast* growth — analysts are optimists. Haircut the growth number and see if it still looks cheap.