Profit margins
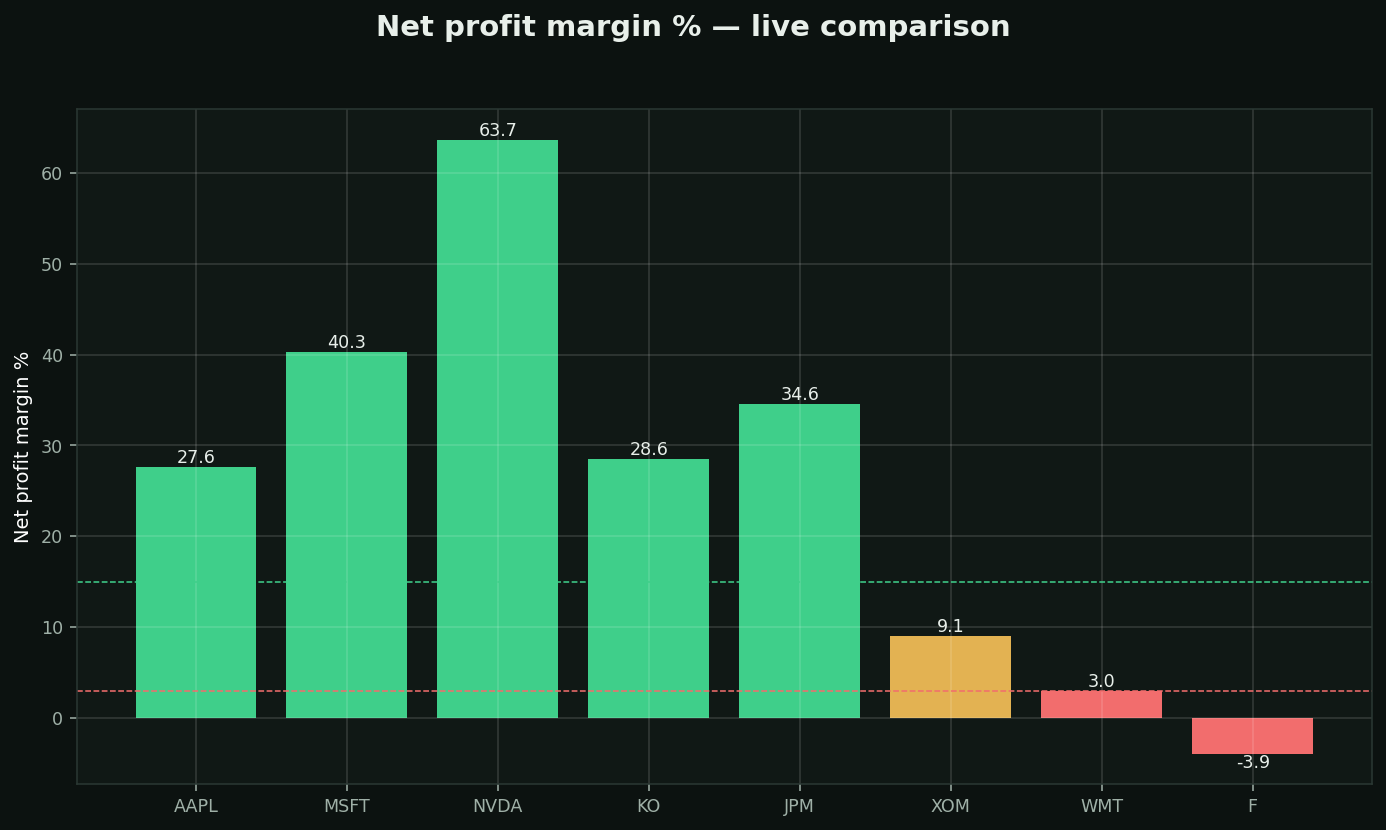
What it is: how many cents of every sales dollar survive as profit. Margin = pricing power made visible.
Rules of thumb:
• 15%+ (green) = strong pricing power · 5-15% = normal · under 3% = razor thin
• Grocery stores live at 2%; software lives at 25%+ — compare within industries
What direction matters more than level: EXPANDING margins = the business is getting stronger (raising prices or cutting costs). SHRINKING margins = competition is winning. Two quarters of margin decline is one of the earliest warnings a great stock is in trouble.
Chart: live net margins — notice retail (WMT) vs tech (MSFT/NVDA).