Volume Rate of Change
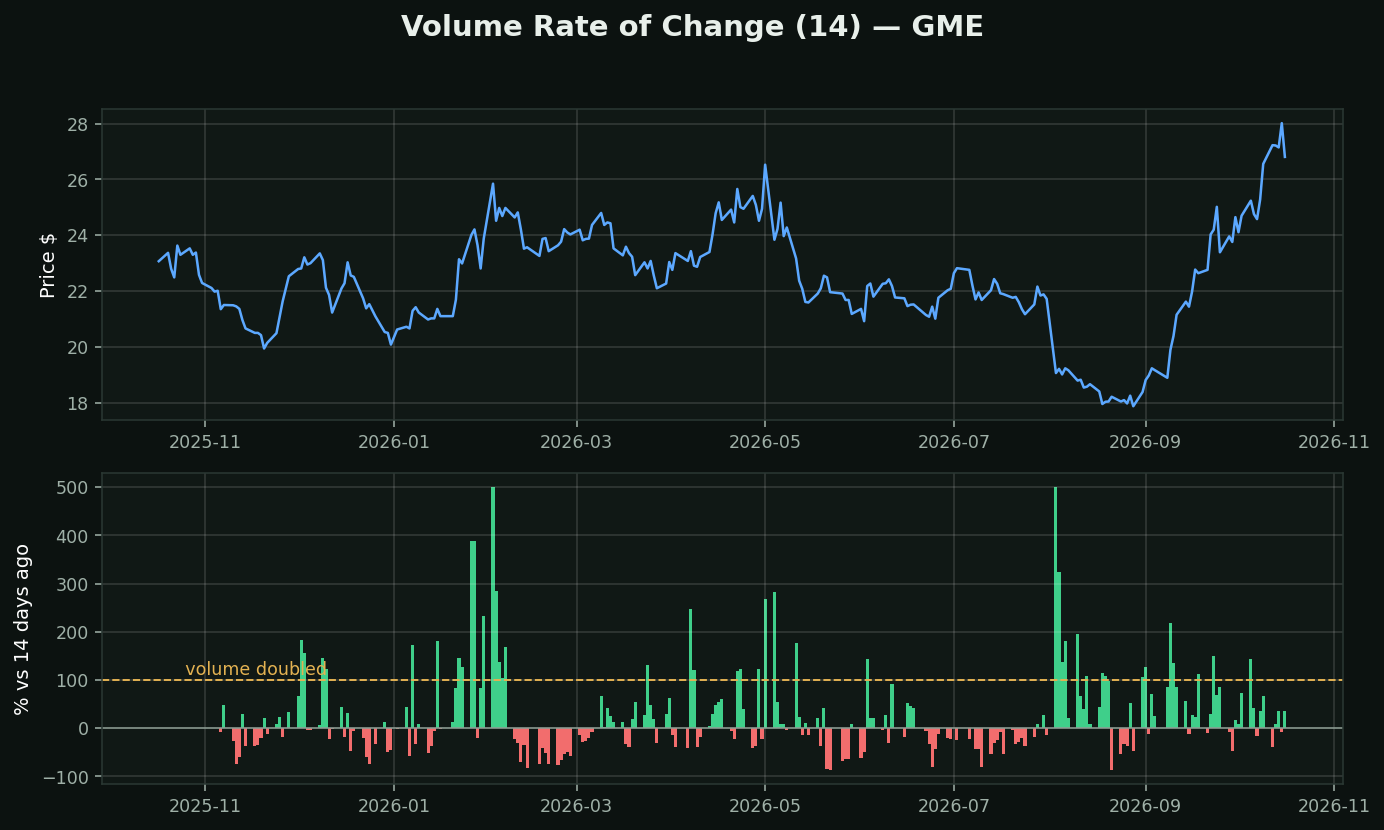
What it is: today's volume against volume N days ago, as a percent. +100 means volume has doubled.
Why a percentage and not the raw bars: volume bars at the bottom of a chart are almost unreadable. They have no fixed scale, they drift over years as a stock's float and popularity change, and your eye anchors on whatever the tallest bar in the visible window happens to be. Change the zoom and "heavy volume" becomes "normal". A percentage does not move when you scroll.
The catch you must know about: it compares against ONE day — the day N bars back. If that day was itself a freak, every reading for the next N days is distorted. Volume Oscillator (5-day average vs 20-day average) has no single-day anchor and is the more robust version of the same question.
How traders use it:
• A surge with no news is the one to investigate
• Breakout confirmation — a level giving way on +100% volume is a different event from the same break on -30% volume
• Exhaustion — extreme volume after a long move often marks the end of it, not the middle
Volume is not direction. It tells you how many people showed up, never which way they voted.