Volume Oscillator
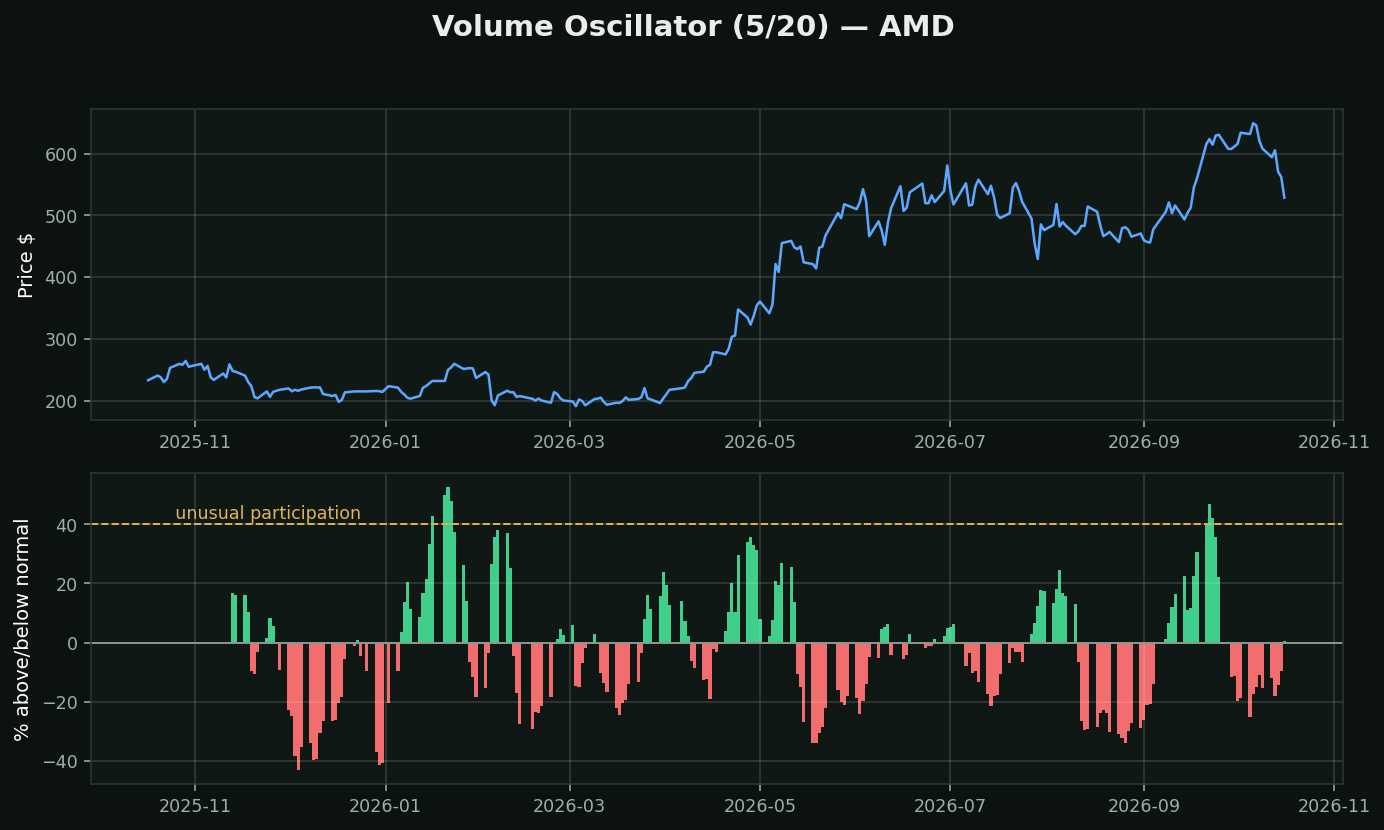
What it is: short-term average volume minus longer-term average volume, as a percentage. It answers *is today busy for THIS stock* — not busy compared to some other stock.
Why the ratio matters: raw volume bars are unreadable across names and across time. SPY trades 70m shares, a small cap trades 300k, and both drift over years. +50% against a stock's own 20-day norm means the same thing in either one.
How traders use it:
• Rising price + rising oscillator → the move has participation
• Rising price + falling oscillator → the move is running on fumes; the buyers who wanted in are in
• A spike with no news is the one worth investigating — somebody knows something, or a large holder is repositioning
A caution: volume is not direction. In this toolkit's own testing a volume spike only carried information once it was paired with RSI — the spike told you *something* happened, RSI told you what to do about it. Volume Rate of Change is the same measure expressed as a simple percent change and reads identically.