True Strength Index
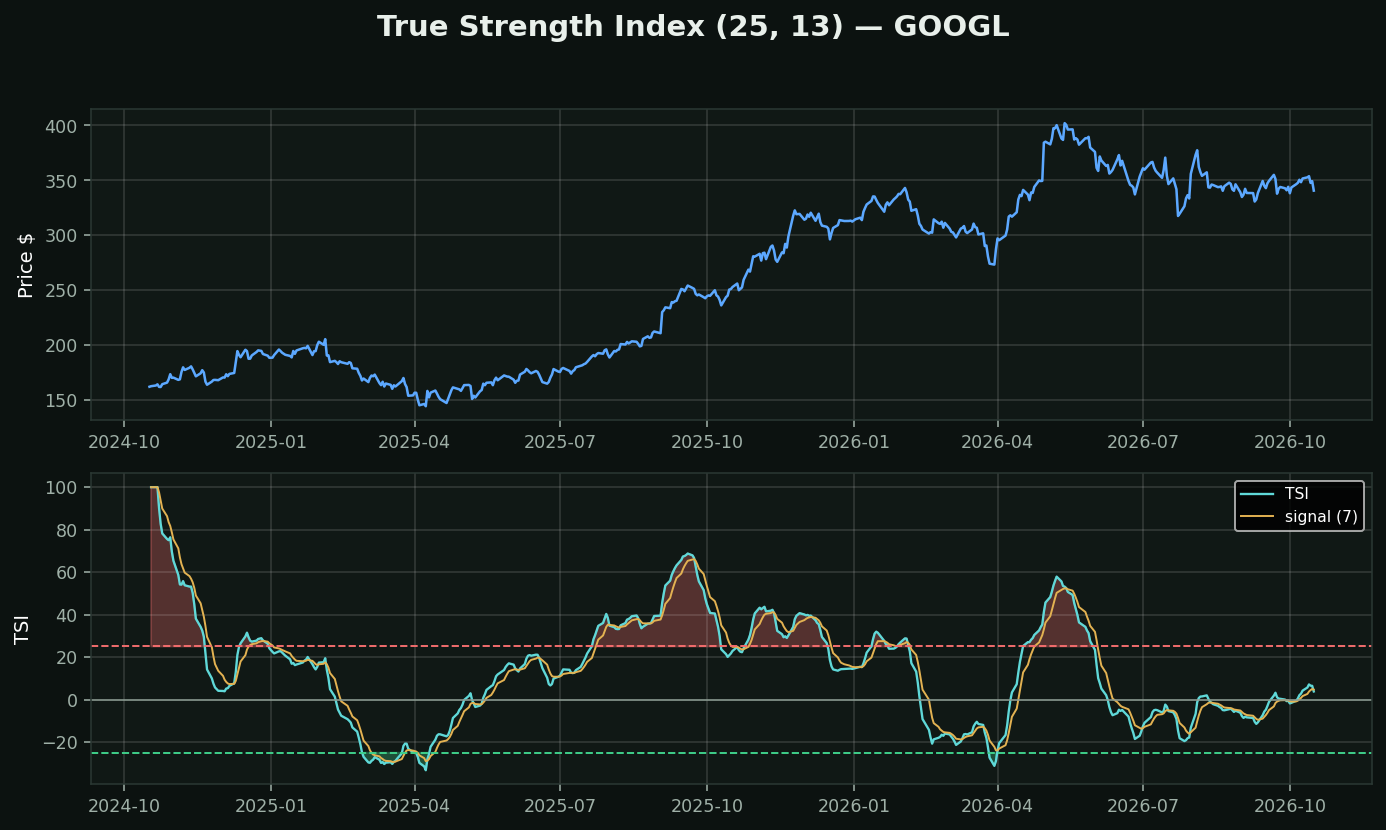
What it is: double-smoothed momentum, divided by double-smoothed ABSOLUTE momentum, times 100. William Blau, 1991. Runs roughly -100 to +100.
The clever part is the denominator. Raw momentum in dollars is useless across stocks — $2/day is a rampage in a $15 name and noise in NVDA. Dividing by the size of the typical daily move normalises it, so the output means the same thing on any chart at any price. That is the same normalisation trick behind RSI and CMO, applied to smoothed data.
What you get: a line that is nearly as smooth as TRIX but bounded like RSI. So it can do two jobs — zero-line for direction, extremes for stretch — where most of this category does one.
How traders use it:
• Above/below zero → medium-term drift
• ±25 as soft overbought/oversold; ±40 on volatile names
• Divergence, and because of the double smoothing, a clean one
Honest placement: it is a better-built MACD. Better built is not the same as profitable.
What testing here found: this is a trend-following tool, and that family did not survive its own test. Over 413,946 stock-days, "price above its moving averages" preceded -0.46% at 21 days (t=-4.40) while downtrend preceded +1.14% (t=+6.02). Use it to describe a trend and to manage a stop — not to decide direction.