Schaff Trend Cycle
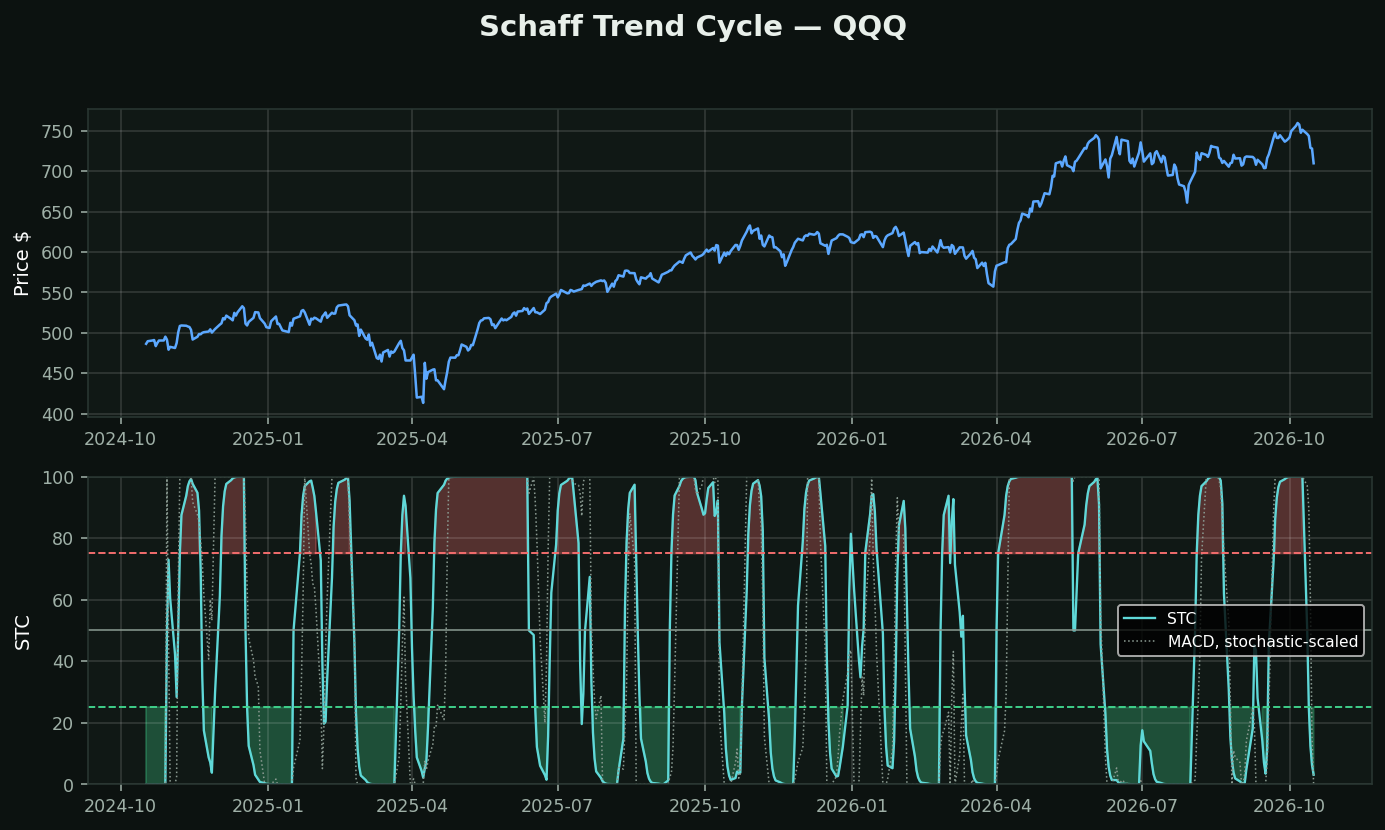
What it is: MACD, run through the Stochastic formula twice. Doug Schaff, 1999. The result is bounded 0–100 and turns considerably earlier than the MACD it is built from.
The problem it attacks: MACD's signal is a crossover, and a crossover is by definition late — the lines have to actually cross before it tells you anything. Rescaling MACD to where it sits in its own recent range means STC can register a turn while MACD is still heading the other way.
Read that again, because it is the catch. Nothing was added. The earlier signal comes entirely from rescaling — it is the same information, amplified. Amplifying a signal amplifies its noise exactly as much, which is why STC pins at 0 and 100 far more than MACD ever does.
How traders use it:
• Crossing up through 25 / down through 75 as the trigger
• Pinned at 100 for weeks = a strong trend, and the indicator has nothing left to tell you until it leaves
• It assumes a cycle exists. In a trending market it will call tops repeatedly and be wrong each time
What testing here found: this is a trend-following tool, and that family did not survive its own test. Over 413,946 stock-days, "price above its moving averages" preceded -0.46% at 21 days (t=-4.40) while downtrend preceded +1.14% (t=+6.02). Use it to describe a trend and to manage a stop — not to decide direction.