RSI (Relative Strength Index)
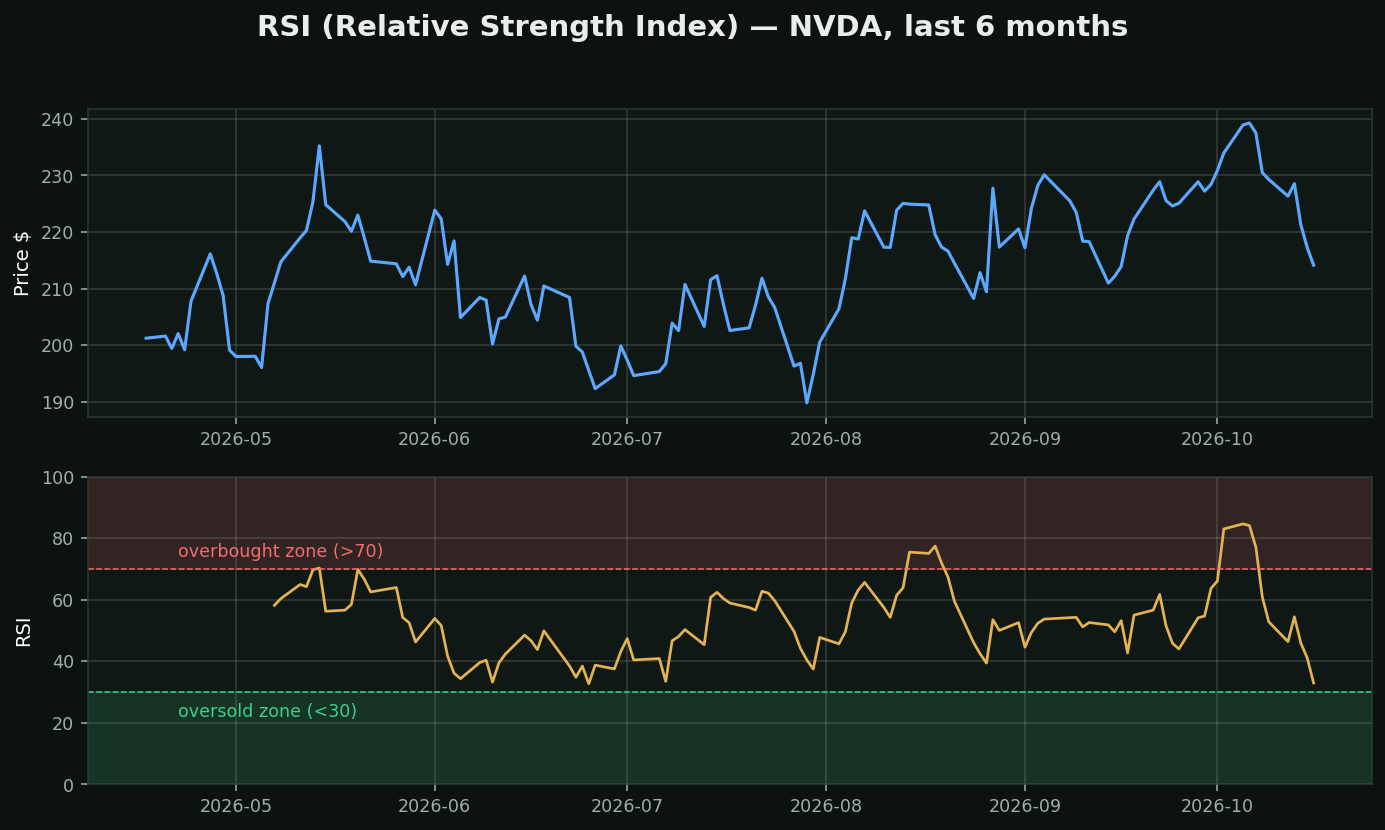
What it is: a 0–100 speedometer for how hard a stock has been bought or sold over the last 14 days.
How to read it:
• Below 30 (green zone) = oversold — sellers may be exhausted; bounces often start here
• Above 70 (red zone) = overbought — buyers stretched; pullbacks more likely
• 40–60 = neutral, no signal
How traders use it: NOT as a buy/sell button — as a *timing filter*. A stock you already like + RSI under 30 = better entry. Strong stocks can stay overbought for weeks, so RSI >70 alone is not a short signal.
Chart: NVDA with its RSI below. Current RSI: 33.
What testing here found: the contrarian read holds. Across 413,946 stock-days, RSI-oversold names beat the base rate by +0.82% over the next 21 days (t=+4.09) and overbought names trailed by -0.58% (t=-4.27). One of the few technical signals in this toolkit that survived its own test.