Relative Volume
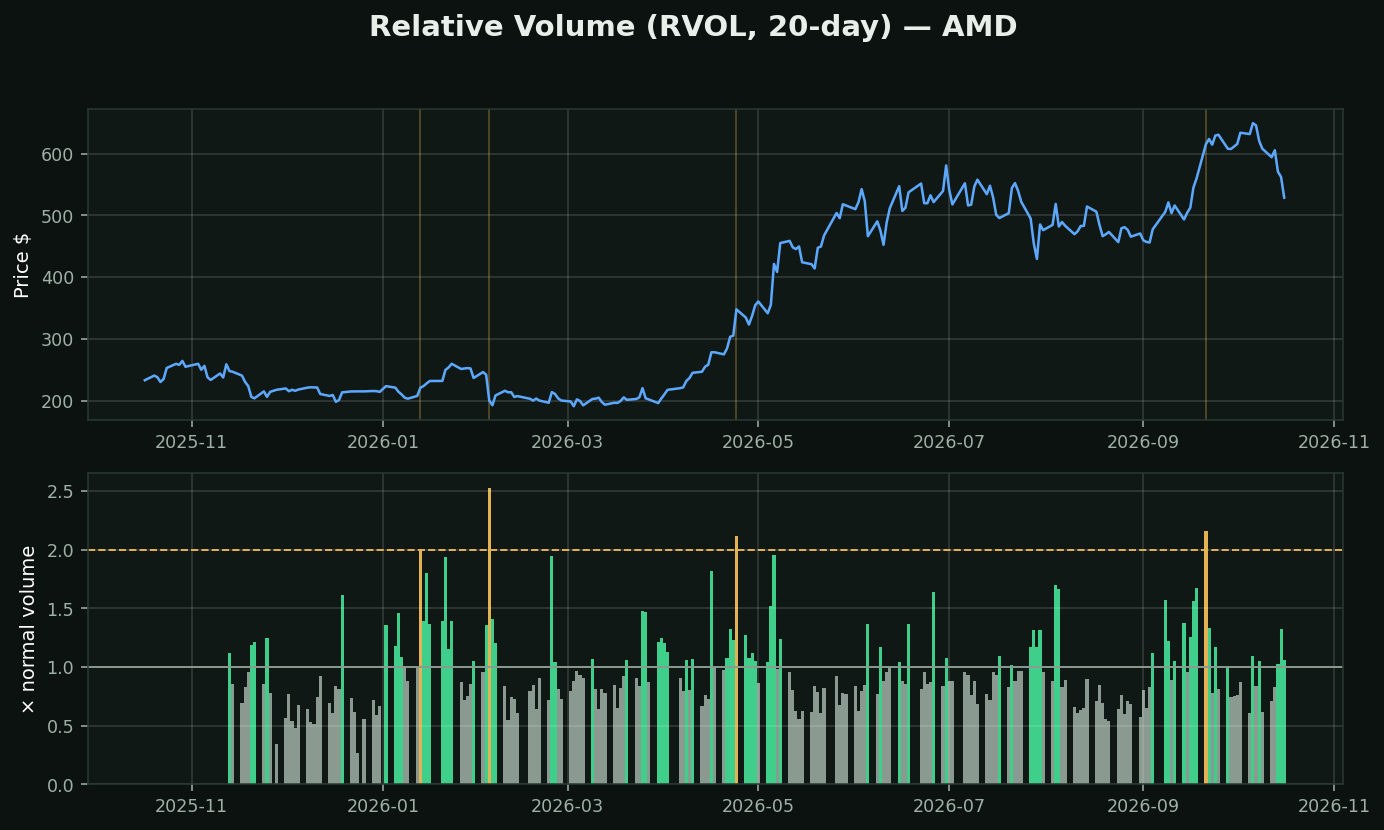
What it is: today's volume divided by what this stock normally trades. RVOL 1.0 is an ordinary day. RVOL 3.0 means three times the usual crowd showed up. This is the single most-used number on a day trading desk and it is barely taught.
Why it beats raw volume: it is comparable across every stock on your screen. A small cap doing 2 million shares and SPY doing 70 million are meaningless side by side; RVOL 4.0 and RVOL 0.8 are not. It turns volume into a ranking you can sort a watchlist by.
The intraday version — what your platform's Projected Volume studies do: at 10:30am you cannot compare today's running total to a full day's average. So they compare against the average volume *by this time of day*, and project a full-day figure from it. Same idea, corrected for the U-shaped volume curve — heavy at the open and close, dead at lunch.
How traders use it:
• RVOL above 2 = something happened. Find out what before trading it — earnings, an upgrade, an index add, a lawsuit
• RVOL below 0.7 = wide spreads and unreliable levels
• A breakout on RVOL under 1 is usually not a breakout
Chart: AMD is at 1.1× normal; amber marks every 2×+ day.