Prime Number Bands (and why they are on the menu)
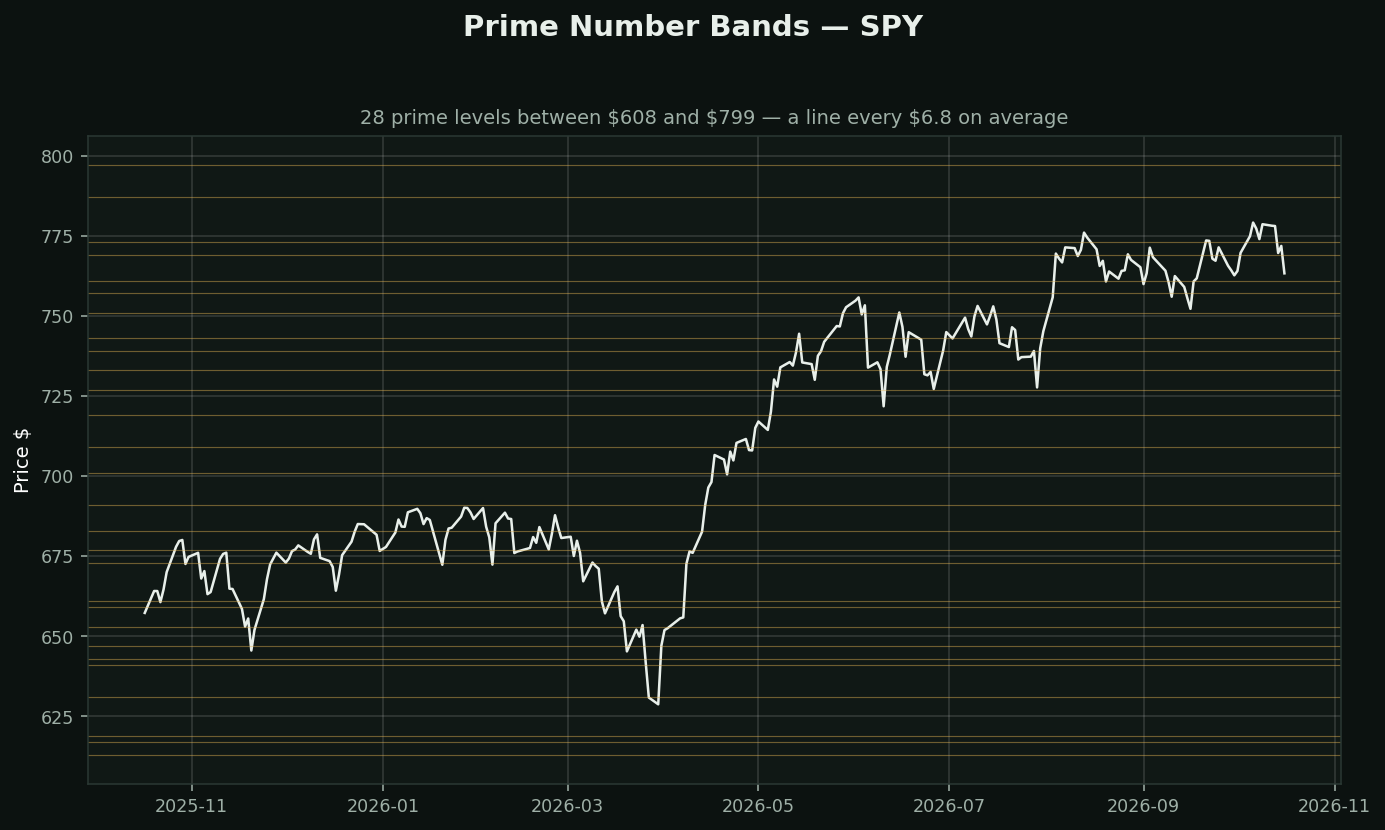
What it claims: that prime numbers act as support and resistance. The bands are drawn at prime price levels; the Prime Number Oscillator measures distance to the nearest one.
This is the only lesson in the catalogue that ends in 'do not use this', and it earns its place by showing you how to spot the next one.
Problem one — no mechanism. Support exists because someone has an order there: a prior high, a big round number people anchor on, a level where an institution built a position. Primality is a property of integers. Nobody's order sits at $149 *because 149 is prime*.
Problem two — it cannot be wrong. Between $608 and $799 there are 28 primes: a line roughly every $6.8. Price cannot move without touching one. Any reversal is 'near a prime level', and a claim no observation can contradict is not a claim.
Problem three — units. A stock at $149 is 'prime'. The same company in euros, or after a 2-for-1 split, is not. A real market force does not depend on the currency you quote it in.
The transferable test — ask any study three questions: What is the mechanism? What observation would prove it wrong? Does it survive a change of units? Fractal Chaos, Gopalakrishnan and most named-after-the-author studies fail at least one.