Performance Index
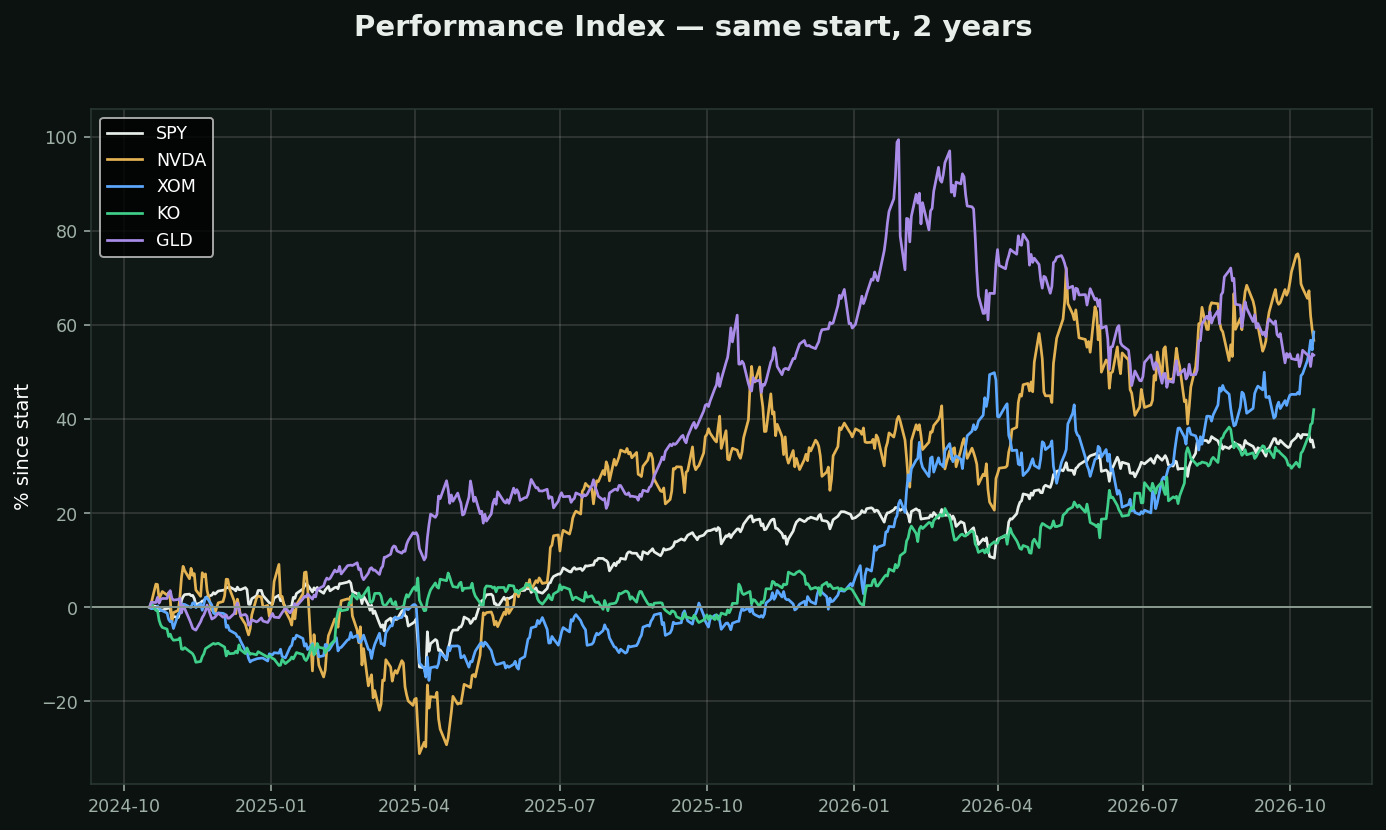
What it is: price as a percentage change from a chosen starting point. Rebase everything to zero on the same day and plot them together. The simplest study in the entire library and the one most worth having on a chart.
Why it matters more than its complexity suggests: a price chart cannot be compared to another price chart. A $900 stock and a $40 stock on the same axis tells you nothing — the expensive one dominates the scale and the cheap one looks like a flat line. Percentage change puts them on equal terms.
On this chart, two years from the same starting line:
• XOM +59%
• NVDA +57%
• GLD +54%
• KO +42%
• SPY +34%
That is a 24-point spread between best and worst, over exactly the same market, the same Fed and the same news cycle.
The question it forces you to ask: every position you hold is competing with every one you did not take. "Up 12%" is not a result until you know what the index did. If your stock is up 12% and SPY is up 20%, you took single-stock risk and got paid less than the thing that required no work at all.
How traders use it: relative strength against a benchmark, sector rotation, and pair trades. It is the foundation the Compare category is built on.