Klinger Volume Oscillator
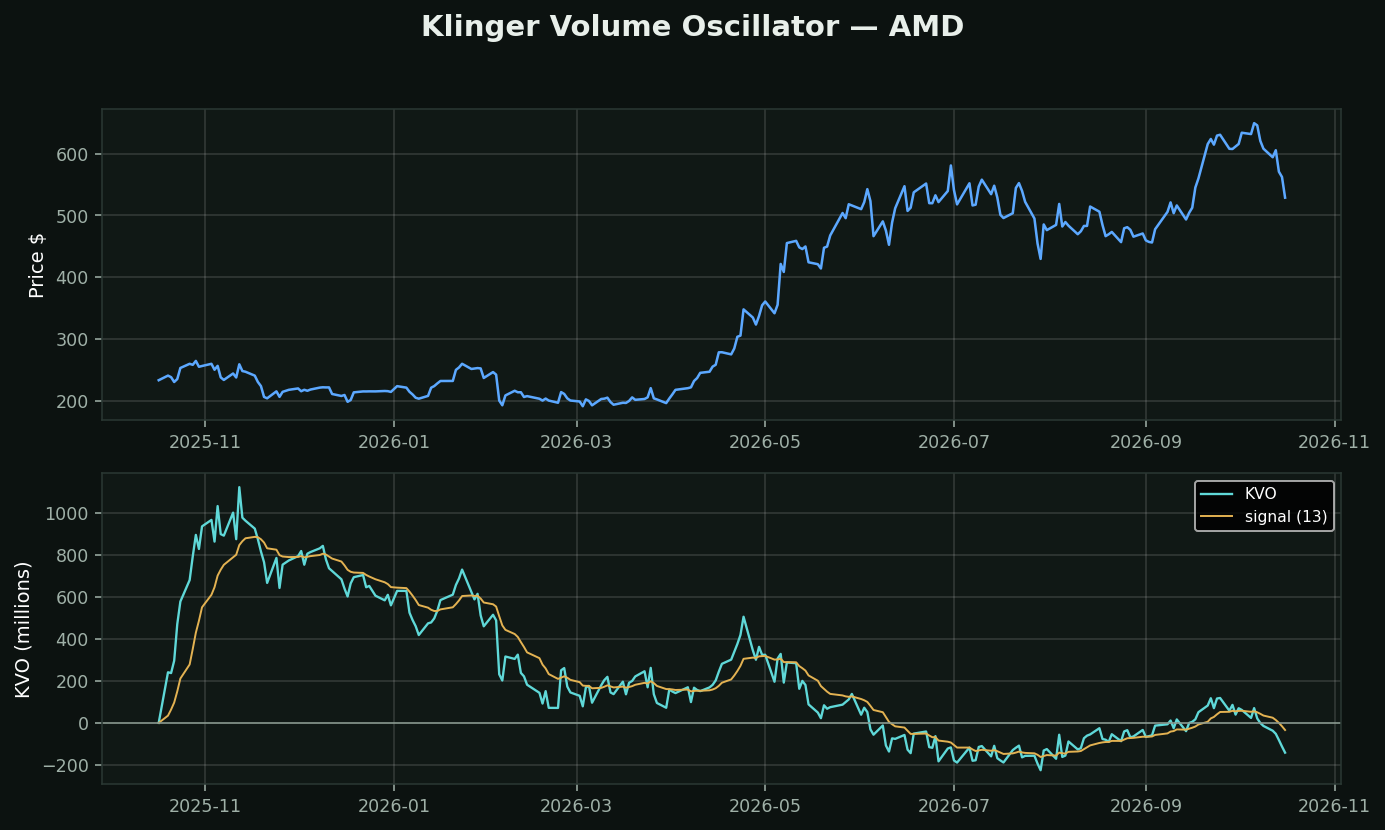
What it is: the most complicated formula in the volume category. Stephen Klinger's attempt to build one indicator that reads both the short-term flow and the long-term trend at once, by taking a volume-force measurement and running a MACD across it.
The one genuinely novel piece — 'volume force': it scores each day's volume by how the day's range compares to the *cumulative range since the trend last changed*. A wide day early in a new move counts for much more than an equally wide day late in an exhausted one. No other study here has a sense of *where in the move you are*.
Why it is not more widely used: the formula has several hand-chosen pieces — the trend definition, the cumulative reset, the 34/55/13 periods — and no published derivation for any of them. When an indicator has that many free parameters, it can be fitted to look excellent on any chart you choose to show.
How it is used: zero-line and signal-line crossings, and divergence against price.
The honest read: a good idea (range context) buried in enough arbitrary machinery that you cannot tell whether the good idea is what is producing the output.