'Go / No Go' trend consensus
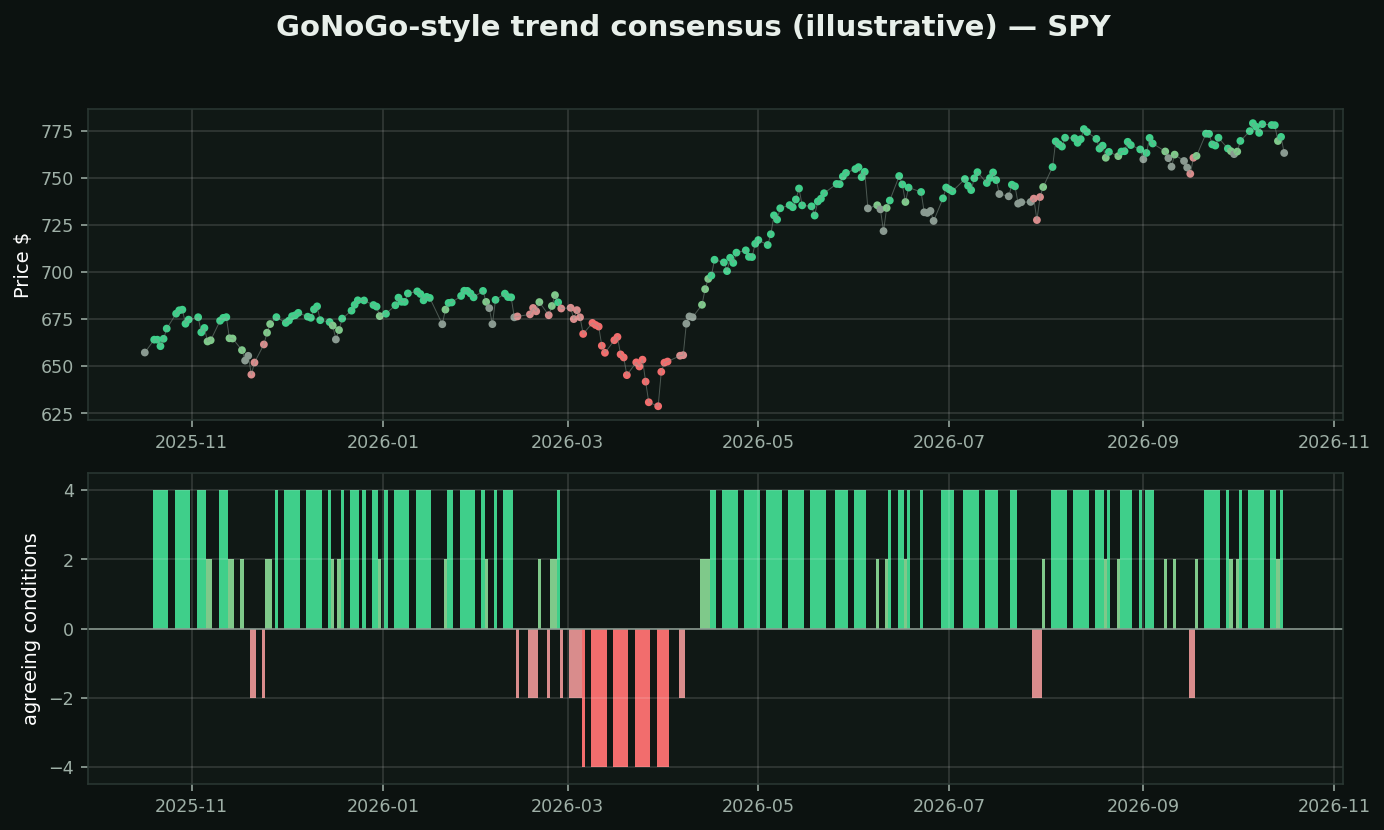
What this family is: a composite that takes several ordinary indicators, counts how many agree, and paints the chart a colour. Strong green means everything agrees the trend is up; amber means the committee is split. Several commercial versions exist; the one in your study library is proprietary.
The chart above is a transparent stand-in — four plain conditions (price vs EMA20, EMA20 vs EMA50, RSI vs 50, MACD sign), scored -4 to +4. Not the vendor's formula, whose weights are not published. That difference matters and it is the lesson.
Why a composite feels so much better than it is: four agreeing indicators reads as four independent confirmations. It is not. edu_bot's `indicator-overload` lesson measures six studies from this family at 0.77 average correlation — they are largely one opinion counted several times. A consensus among near-copies is not evidence, it is an echo.
And a proprietary composite cannot be audited. You cannot know what it weights, so you cannot know what it fails at, and you cannot test it. This toolkit's own trend scores were measured, found inverted, and fixed. That was only possible because the formula was visible.
If you use one: treat the colour as a summary of your own chart, never as new information.
What testing here found: this is a trend-following tool, and that family did not survive its own test. Over 413,946 stock-days, "price above its moving averages" preceded -0.46% at 21 days (t=-4.40) while downtrend preceded +1.14% (t=+6.02). Use it to describe a trend and to manage a stop — not to decide direction.