Ehlers Fisher Transform
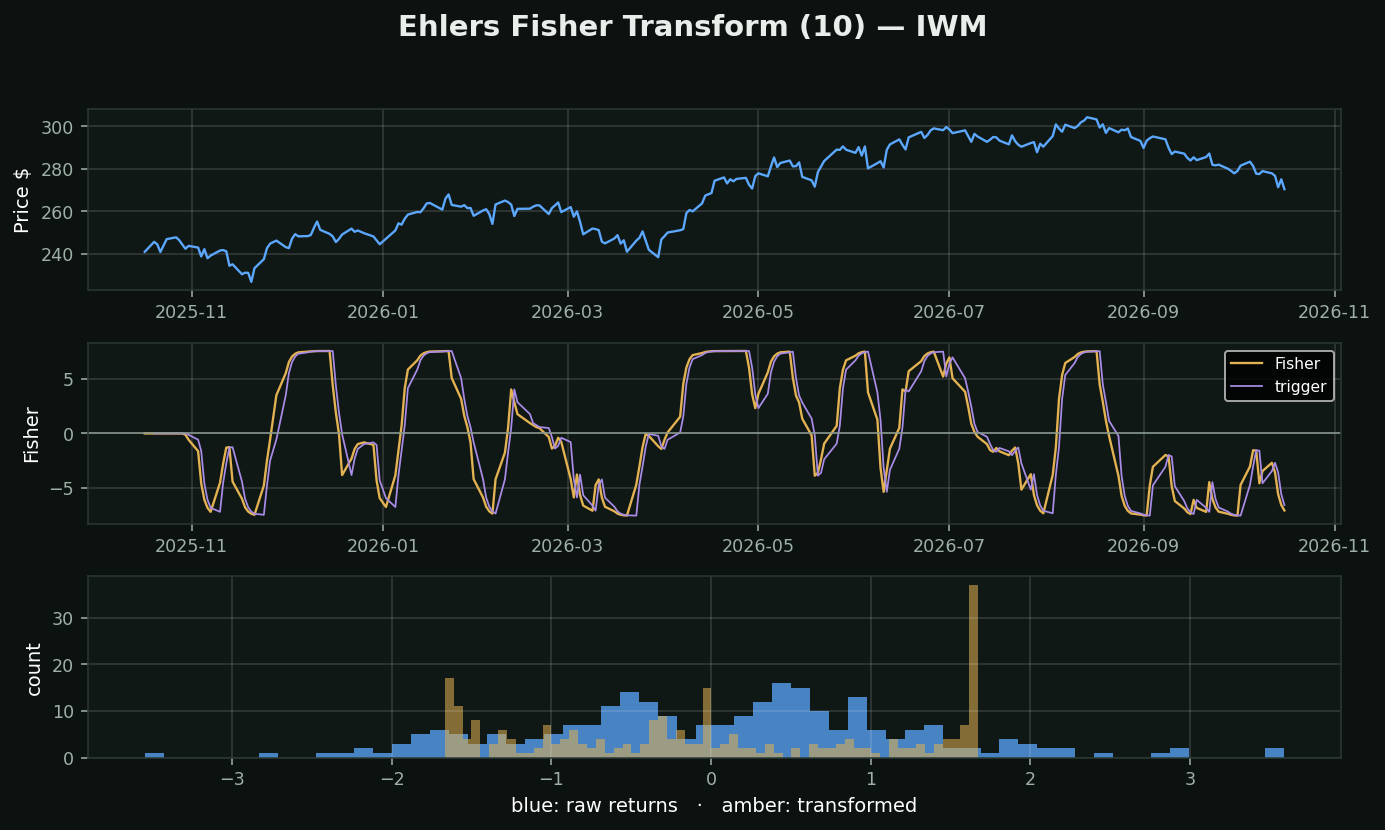
What it is: John Ehlers, an engineer who came to markets from signal processing. It squeezes price into a -1..+1 range and then applies the Fisher transform, `0.5 × ln((1+x)/(1−x))`.
The actual insight, and it is a real one: price returns are NOT normally distributed. They pile up near the middle with fat tails — look at the blue histogram at the bottom. Almost every statistical threshold in technical analysis (2 standard deviations, z-scores, Bollinger Bands) quietly assumes a bell curve that is not there.
What the transform does: it reshapes that distribution toward something closer to normal — the amber histogram. Extreme readings become genuinely rare instead of routine, so a spike actually means something. Turning points become sharp rather than rounded.
How traders use it: crossings of the line and its 1-bar-lagged trigger, and extreme absolute readings as reversal warnings.
The honest caveat: it is still built on a 10-period high/low range, so it inherits every weakness of Stochastic. The transform improves the STATISTICS of the output, not the quality of the input. Better maths on the same information is still the same information.
What testing here found: the contrarian read on this family holds up. Across 413,946 stock-days, RSI-oversold names beat the base rate by +0.82% over the next 21 days (t=+4.09) and overbought names trailed by -0.58% (t=-4.27). Oscillators that measure stretch survived their test here; the trend-followers did not.