Fibonacci retracement
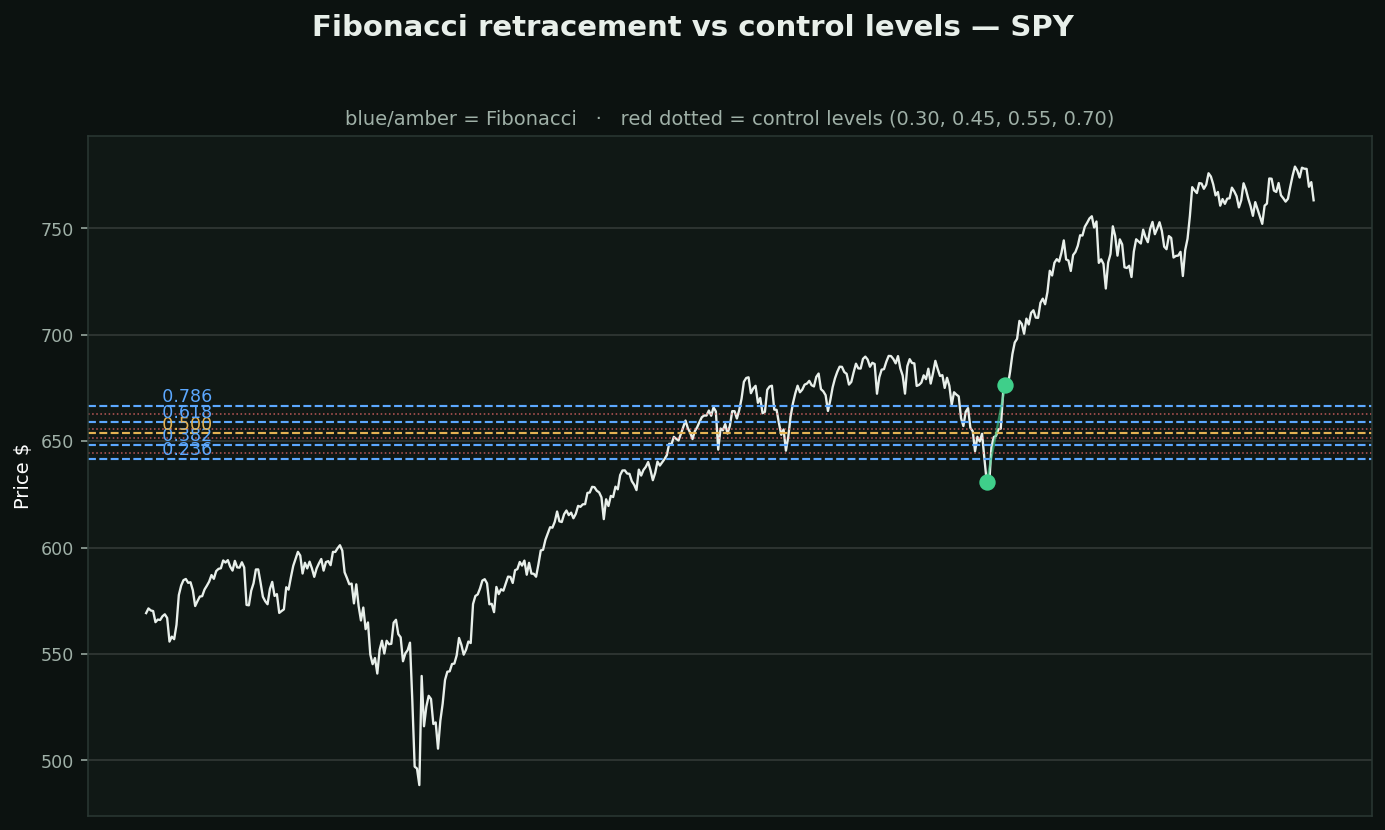
What it is: anchor a tool to a swing high and low, and it draws horizontal lines at 23.6%, 38.2%, 50%, 61.8% and 78.6% of that move. The ratios come from the Fibonacci sequence, where each number divided by the next approaches 0.618.
Why people believe it: the ratio turns up in sunflower seed spirals and nautilus shells, and the argument is that markets are natural systems too. Note that 50% is on every Fib tool ever built and is not a Fibonacci ratio at all — it is there because halfway is a sensible place to look.
The chart shows the test. Blue and amber are the Fibonacci levels. The red dotted lines are controls — 0.30, 0.45, 0.55, 0.70 — chosen precisely because they have no significance.
What testing here found: anomaly_scanner checked this on SPY against control levels that are NOT Fibonacci numbers — 0.30, 0.45, 0.55, 0.70. Price reversed at the Fibonacci levels 31% of the time (n=195) and at the arbitrary ones 33% (n=159). The Fib levels did slightly worse than numbers picked for having no significance at all.
So what is left? The self-fulfilling part is real: enough people watch 61.8% that orders cluster there. But that is an argument about crowds, not about mathematics, and it applies equally to round numbers, which are watched harder.