EV/EBITDA
What it is: the "whole business" price tag. EV (enterprise value) = market cap + debt − cash: what you'd really pay to buy the entire company. Divided by its raw operating profit.
Why pros prefer it to P/E: P/E ignores debt. Two companies with the same P/E can be wildly different buys if one is drowning in debt. EV/EBITDA catches that; it's the metric buyout firms actually use.
Rules of thumb:
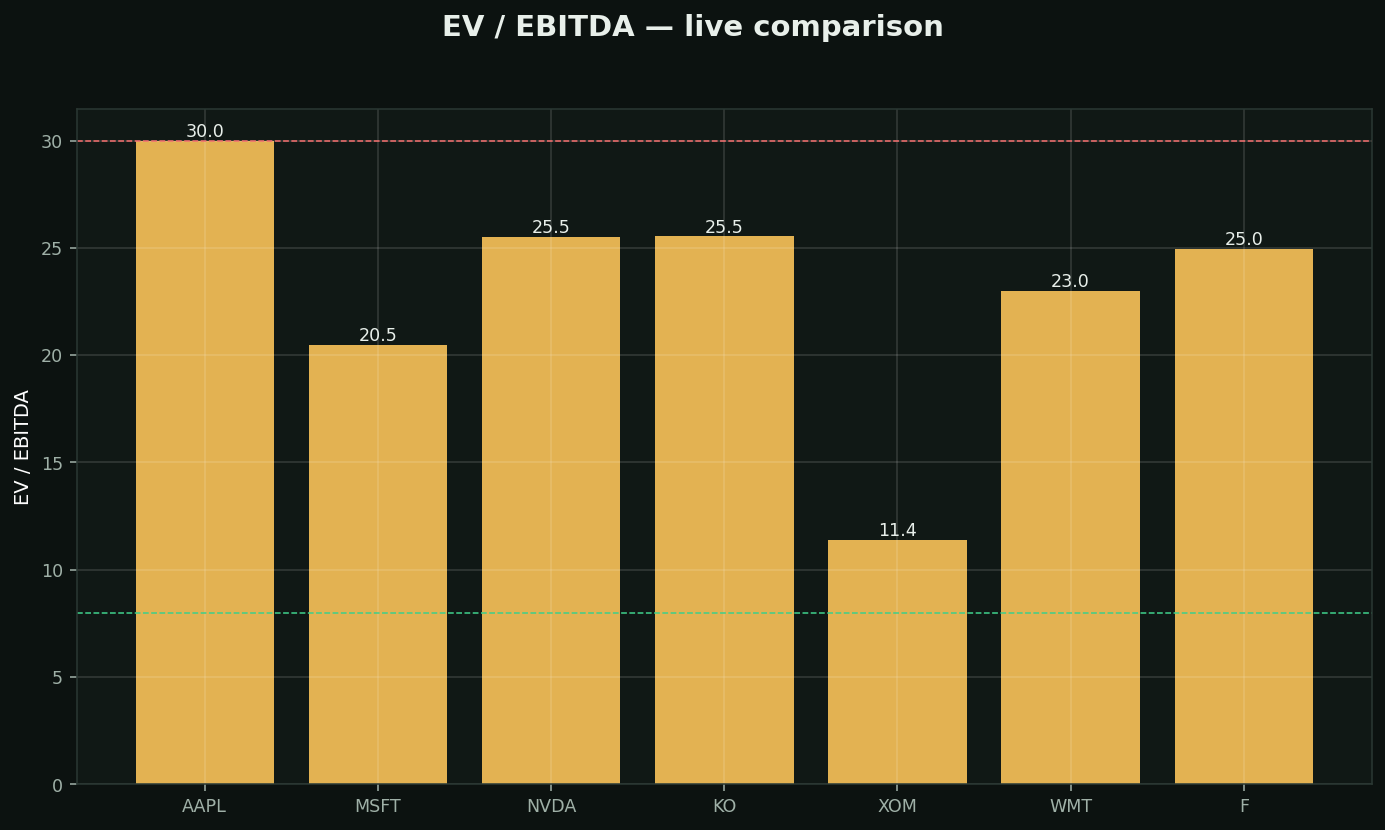
• Under 8 (green) = cheap enough that acquirers start circling
• 8-15 = normal · over 30 (red) = priced for perfection
Chart: live EV/EBITDA across industries — same caveat as always, compare like with like.