Donchian Channels
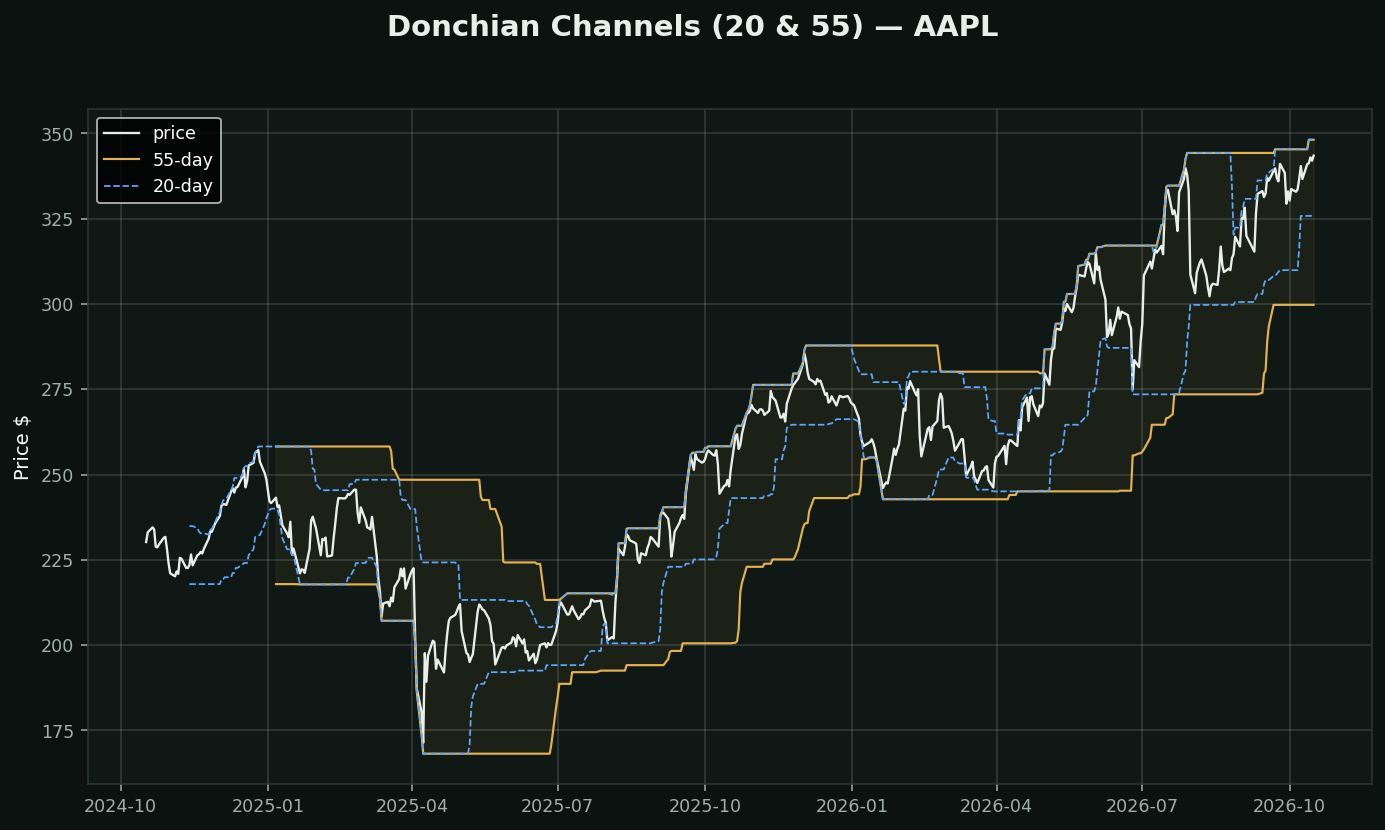
What it is: the highest high and lowest low of the last N days. That is the entire formula. No averaging, no smoothing, no parameters beyond N.
Why it is famous: this is the Turtle system. In 1983 Richard Dennis bet his partner he could teach complete beginners to trade, handed them a rule — buy a 20-day high, exit a 10-day low, size by ATR — and they reportedly made a fortune. The lesson was never that breakouts are magic; it was that a mediocre rule followed exactly beats a good rule followed sometimes.
How traders use it:
• Breakout entry — a close above the 20-day high
• Channel exit — leave on the opposite shorter channel
• The width is a volatility read, same information as bandwidth
You already use this: the 52-week high/low is a Donchian channel at N=252, and your study library's Highest High Value and Lowest Low Value are its two halves sold separately.
A warning: the original Turtle rule has been public for forty years. Breakout edges decay when everyone watches the same line.
What testing here found: this is a trend-following tool, and that family did not survive its own test. Over 413,946 stock-days, "price above its moving averages" preceded -0.46% at 21 days (t=-4.40) while downtrend preceded +1.14% (t=+6.02). Use it to describe a trend and to manage a stop — not to decide direction.