Current ratio (liquidity)
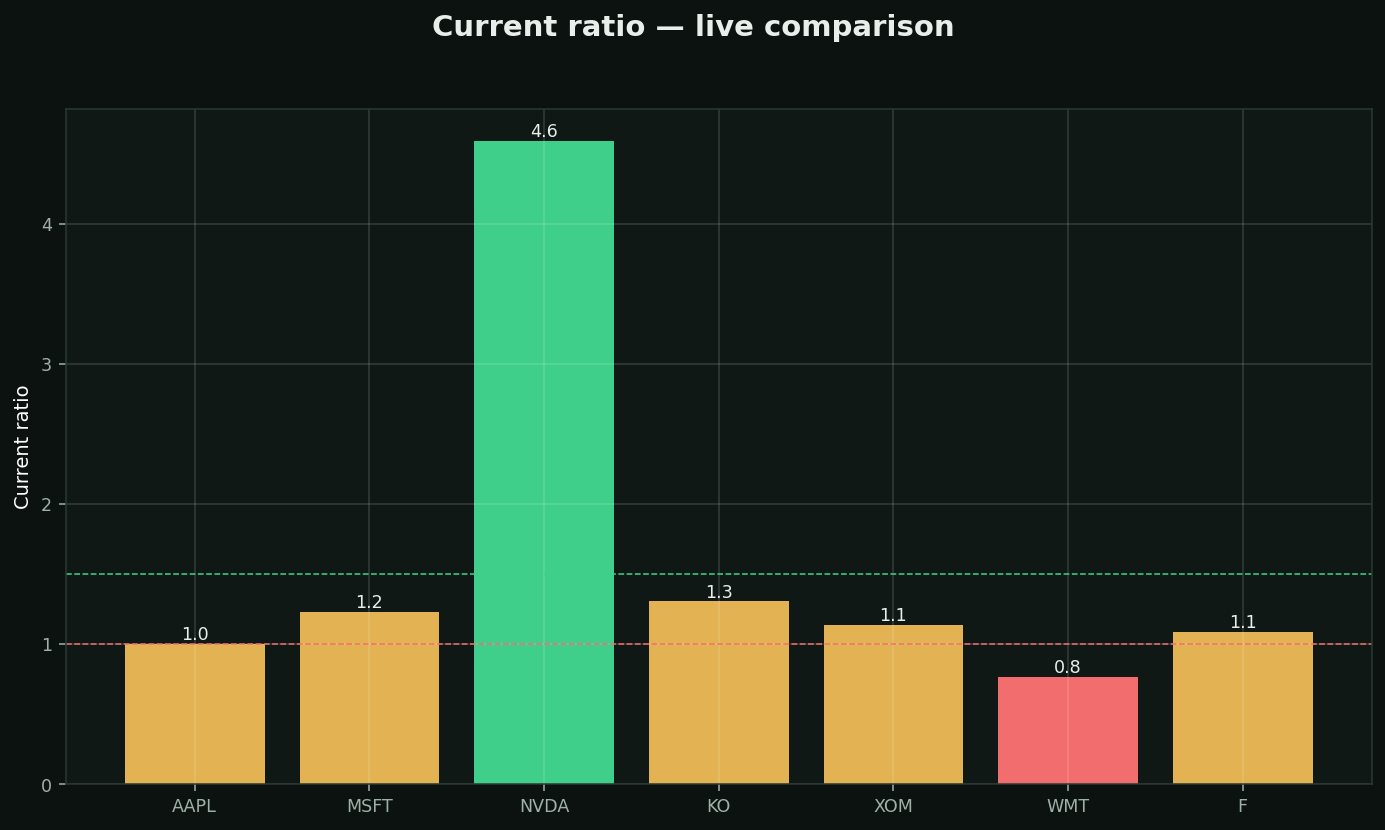
What it is: assets convertible to cash within a year ÷ bills due within a year. Can the company pay what it owes SOON?
Rules of thumb:
• 1.5+ (green) = comfortable cushion · under 1.0 (red) = owes more this year than it can easily raise — needs perfect conditions
• Huge ratios (4+) aren't always a virtue — can mean lazy cash going nowhere
Why it matters when it matters: liquidity is irrelevant right up until credit markets freeze — then it's the ONLY thing. Solvent-but-illiquid companies die in every recession. Retailers with fast inventory turnover run below 1 safely; industrials cannot. Judge within the industry.