Chaikin Volatility
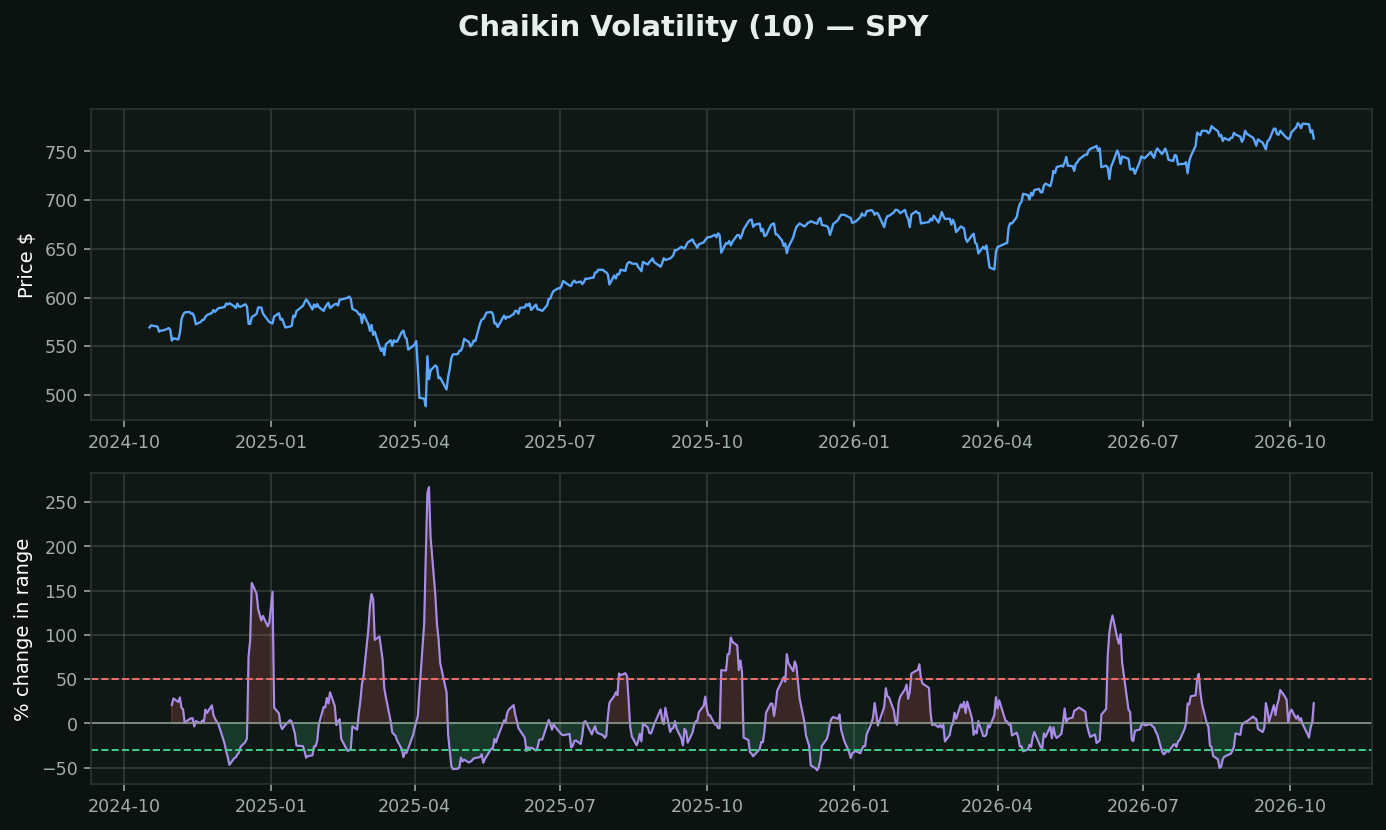
What it is: smooth the daily high−low range over 10 days, then measure how much that smoothed range has changed over the last 10 days. Not the level of volatility — the rate of change of it.
Why the derivative and not the level: ATR tells you the market is volatile. Chaikin Volatility tells you it is *becoming* volatile, which arrives earlier. A reading of +80% means the trading range has nearly doubled in two weeks, and that is usually news breaking rather than a market quietly drifting.
Chaikin's own interpretation, which is the interesting part:
• A sharp spike in volatility tends to mark a BOTTOM. Panic is loud and it ends quickly
• A slow decline in volatility tends to mark a TOP. Complacency is quiet and it takes months
That asymmetry is real and shows up across markets — crashes are fast and violent, tops are slow and boring. It is the same shape as the volatility skew in options pricing, arrived at from a chart.
The weakness: it is built on plain high−low, not true range, so it ignores gaps entirely. On a stock that moves mostly overnight it reads much calmer than the stock actually is.