Market breadth
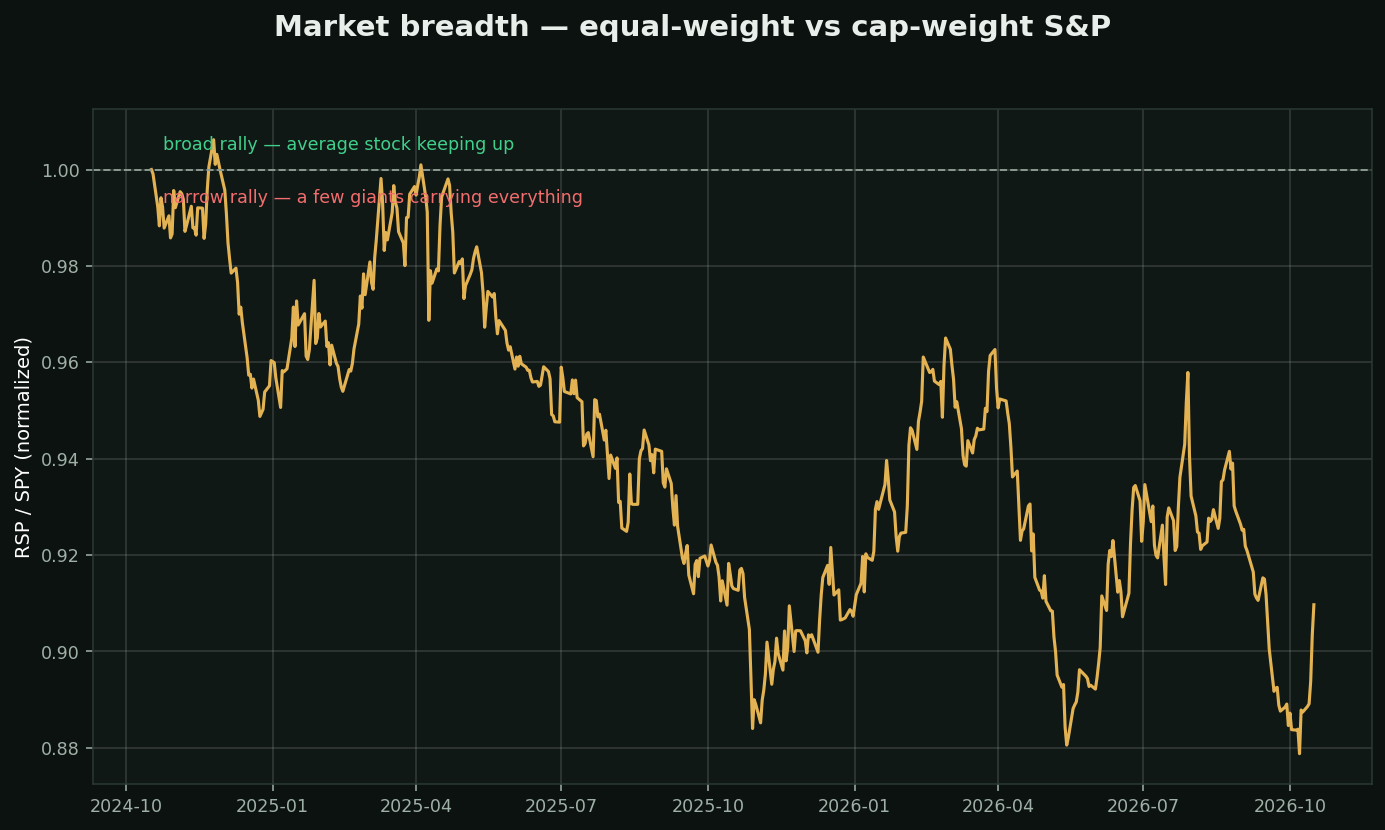
What it is: whether the AVERAGE stock is participating in a rally, or just a few giants. Chart: equal-weight S&P (every stock counts the same) vs regular cap-weight S&P (dominated by megacaps).
How to read it:
• Line rising = broad, healthy rally — hundreds of stocks confirming
• Line falling while the index makes highs = narrow leadership — the index is a facade held up by a handful of names
Why it matters: narrow rallies are fragile — when the few leaders stumble there's nothing underneath. Most major tops showed deteriorating breadth for months first. The index tells you WHAT happened; breadth tells you how much to trust it.