Balance of Power
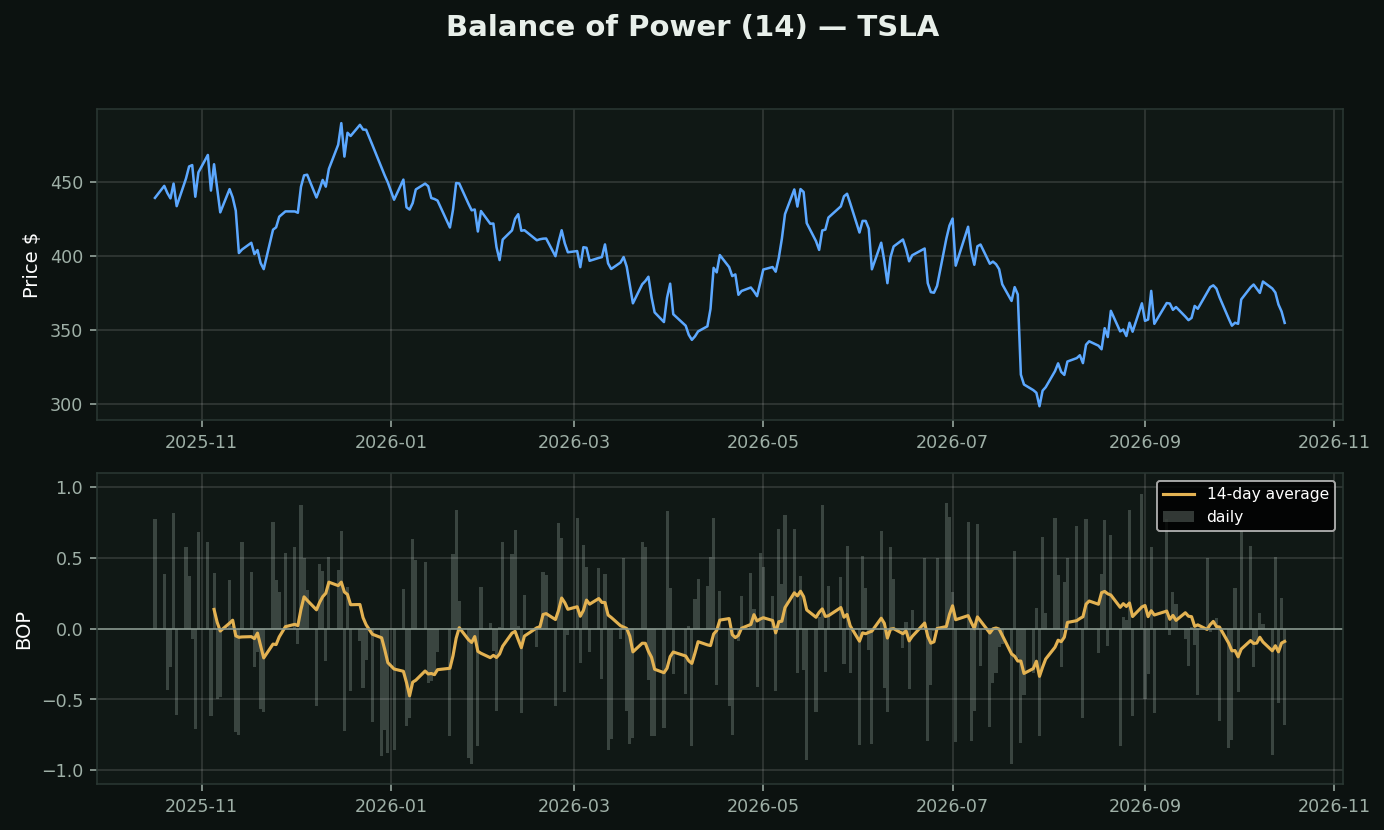
What it is: (close − open) divided by (high − low). One number per day, from -1 to +1, answering: *of all the ground price covered today, how much of it did the buyers keep?*
Why this is not just another momentum line: every other oscillator in this category compares today's close to some earlier close. BOP looks only INSIDE the single bar. A day that opens at the low and closes at the high scores +1 whether the stock finished up 5% or down 5% on the week — it is measuring the fight, not the outcome.
What that catches: the reversal day. A stock crashes at the open, grinds back all session, closes near the high. Price is down, every trend tool is bearish, RSI is falling — and BOP prints strongly positive because the buyers won the day. That is the hammer candle expressed as a number you can screen on.
How traders use it:
• The raw daily value for reversal bars
• The 14-day average for persistent control — grey bars are the daily reading, amber is the smoothing
• Divergence — price falling while BOP averages positive means sellers are running out of people to sell to