The Alligator
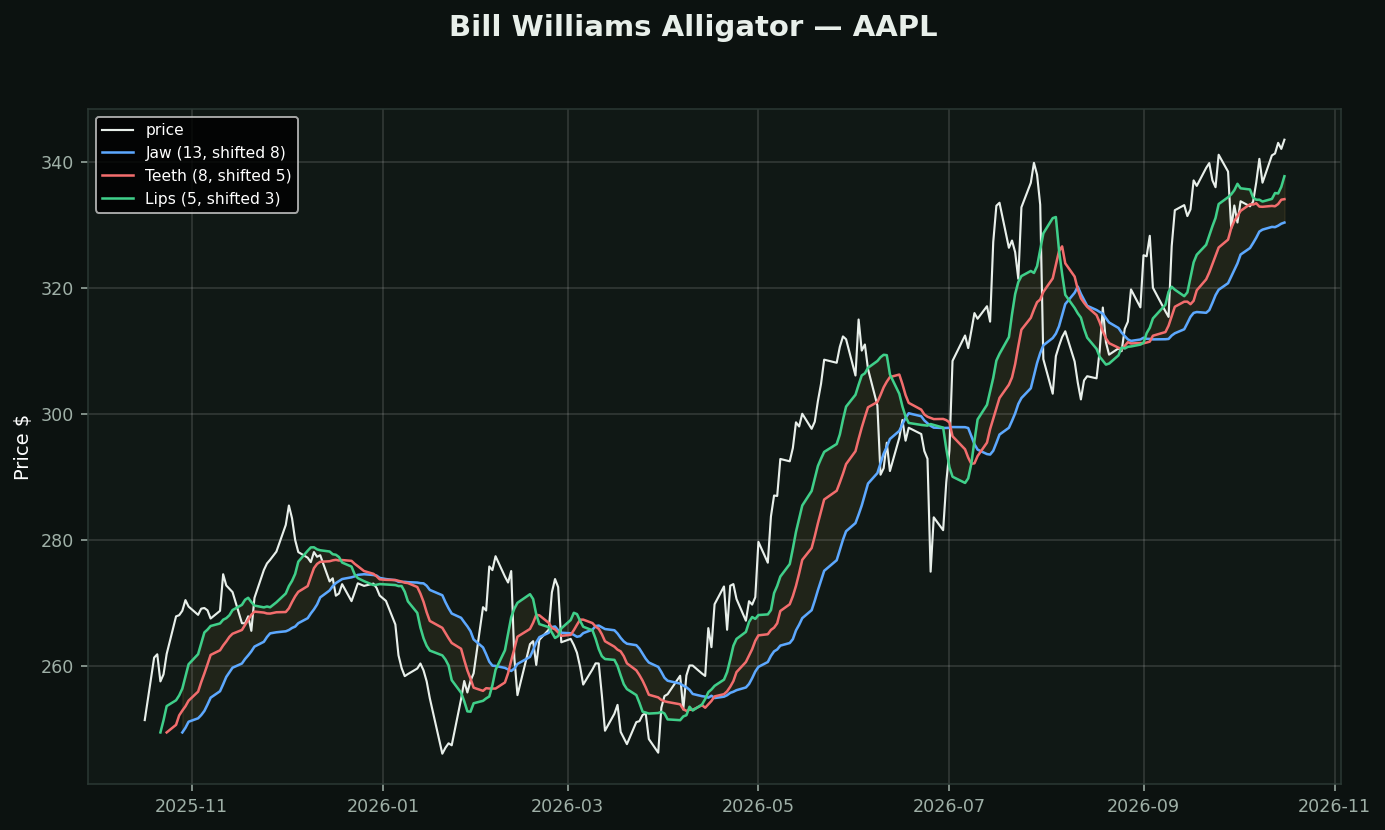
What it is: three smoothed moving averages of the bar's midpoint — 13, 8 and 5 periods — each pushed FORWARD by 8, 5 and 3 bars. Bill Williams named them the jaw, teeth and lips.
The forward displacement is the only real idea here. Shifting an average to the right delays when it reacts, which deliberately keeps the three lines tangled during chop instead of crossing repeatedly. Most multi-average systems generate their worst signals exactly in those conditions; this one is built to stay quiet.
How Williams described it:
• Sleeping — the lines intertwined. No trend. Stay out
• Awakening — they begin to separate
• Eating — fanned out in order, widening. The trend is running
• Sated — they converge again. Take profit
On this chart the lines were in their tightest quartile 25% of the year — the alligator sleeps more than it eats, which is Williams' actual point.
Honestly: strip the animal metaphor and this is three moving averages with a lag added on purpose. The metaphor is doing real work — it makes "do nothing" feel like a position — but the arithmetic carries no information three plain averages lack.
What testing here found: this is a trend-following tool, and that family did not survive its own test. Over 413,946 stock-days, "price above its moving averages" preceded -0.46% at 21 days (t=-4.40) while downtrend preceded +1.14% (t=+6.02). Use it to describe a trend and to manage a stop — not to decide direction.